

202
M. Wu et al.
8.3 Evaluation of Optic Disc Segmentation and C/D Ratio
Quantification
8.3.1 Evaluation of Optic Disc Segmentation
To evaluate the performance of the proposed algorithm, we compared our segmentation results with a previously proposed A-scan classification-based segmentation
method and a manual segmentation on the 42 SD-OCT test volumes. Segmentation
methods based on A-scan classification have been previously proposed in [20, 21,
23] and aim to label each A-scan (corresponding to one pixel in the projection image)
in B-scan images as cup, rim or background using k-NN classifier. We extracted a 15
dimensional feature vector from each A-scan as described in [21] to train the k-NN
classifier. The manual segmentations were generated by two experienced experts
who manually marked the NCO for each B-scan and calculated the cup border by
the reference plane to segment optic disc and cup in projection images. The reference standard was obtained based on the two readers’ consensus results in projection
images.
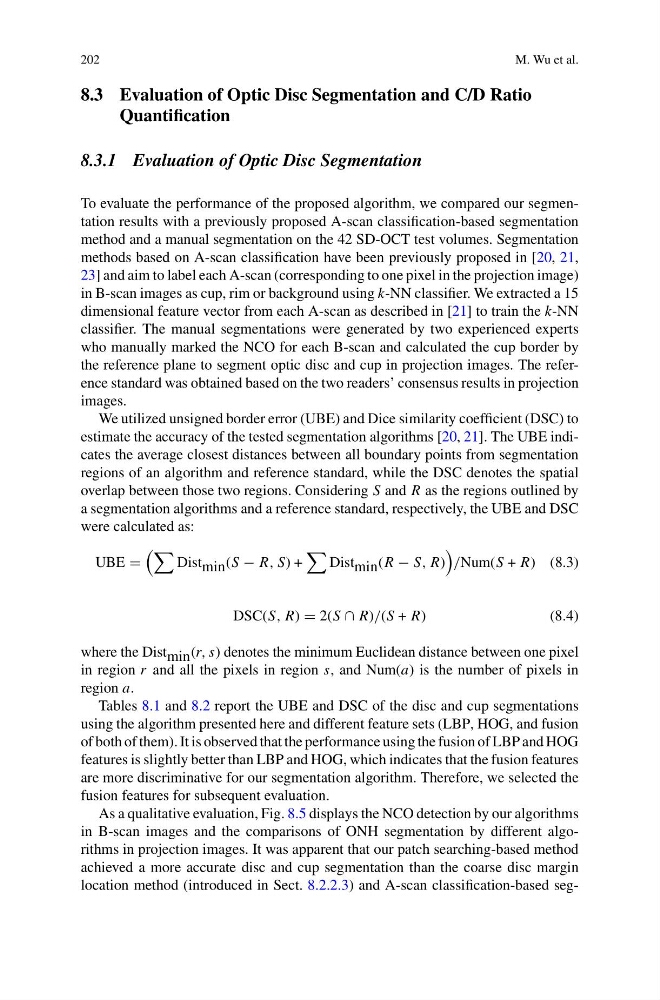
We utilized unsigned border error (UBE) and Dice similarity coefficient (DSC) to
estimate the accuracy of the tested segmentation algorithms [20, 21]. The UBE indicates the average closest distances between all boundary points from segmentation
regions of an algorithm and reference standard, while the DSC denotes the spatial
overlap between those two regions. Considering S and R as the regions outlined by
a segmentation algorithms and a reference standard, respectively, the UBE and DSC
were calculated as:
UBE
Dist min (S − R, S) +
Dist min (R − S, R)
/Num(S + R) (8.3)
DSC(S, R) 2(S ∩ R)/(S + R)
( 8 . 4 )
where the Dist min (r, s) denotes the minimum Euclidean distance between one pixel
in region r and all the pixels in region s, and Num(a) is the number of pixels in
region a.
Tables 8.1 and 8.2 report the UBE and DSC of the disc and cup segmentations
using the algorithm presented here and different feature sets (LBP, HOG, and fusion
of both of them). It is observed that the performance using the fusion of LBP and HOG
features is slightly better than LBP and HOG, which indicates that the fusion features
are more discriminative for our segmentation algorithm. Therefore, we selected the
fusion features for subsequent evaluation.
As a qualitative evaluation, Fig. 8.5 displays the NCO detection by our algorithms
in B-scan images and the comparisons of ONH segmentation by different algorithms in projection images. It was apparent that our patch searching-based method
achieved a more accurate disc and cup segmentation than the coarse disc margin
location method (introduced in Sect. 8.2.2.3) and A-scan classification-based seg-
M. Wu et al.
8.3 Evaluation of Optic Disc Segmentation and C/D Ratio
Quantification
8.3.1 Evaluation of Optic Disc Segmentation
To evaluate the performance of the proposed algorithm, we compared our segmentation results with a previously proposed A-scan classification-based segmentation
method and a manual segmentation on the 42 SD-OCT test volumes. Segmentation
methods based on A-scan classification have been previously proposed in [20, 21,
23] and aim to label each A-scan (corresponding to one pixel in the projection image)
in B-scan images as cup, rim or background using k-NN classifier. We extracted a 15
dimensional feature vector from each A-scan as described in [21] to train the k-NN
classifier. The manual segmentations were generated by two experienced experts
who manually marked the NCO for each B-scan and calculated the cup border by
the reference plane to segment optic disc and cup in projection images. The reference standard was obtained based on the two readers’ consensus results in projection
images.
We utilized unsigned border error (UBE) and Dice similarity coefficient (DSC) to
estimate the accuracy of the tested segmentation algorithms [20, 21]. The UBE indicates the average closest distances between all boundary points from segmentation
regions of an algorithm and reference standard, while the DSC denotes the spatial
overlap between those two regions. Considering S and R as the regions outlined by
a segmentation algorithms and a reference standard, respectively, the UBE and DSC
were calculated as:
UBE
Dist min (S − R, S) +
Dist min (R − S, R)
/Num(S + R) (8.3)
DSC(S, R) 2(S ∩ R)/(S + R)
( 8 . 4 )
where the Dist min (r, s) denotes the minimum Euclidean distance between one pixel
in region r and all the pixels in region s, and Num(a) is the number of pixels in
region a.
Tables 8.1 and 8.2 report the UBE and DSC of the disc and cup segmentations
using the algorithm presented here and different feature sets (LBP, HOG, and fusion
of both of them). It is observed that the performance using the fusion of LBP and HOG
features is slightly better than LBP and HOG, which indicates that the fusion features
are more discriminative for our segmentation algorithm. Therefore, we selected the
fusion features for subsequent evaluation.
As a qualitative evaluation, Fig. 8.5 displays the NCO detection by our algorithms
in B-scan images and the comparisons of ONH segmentation by different algorithms in projection images. It was apparent that our patch searching-based method
achieved a more accurate disc and cup segmentation than the coarse disc margin
location method (introduced in Sect. 8.2.2.3) and A-scan classification-based seg-