

204
M. Wu et al.
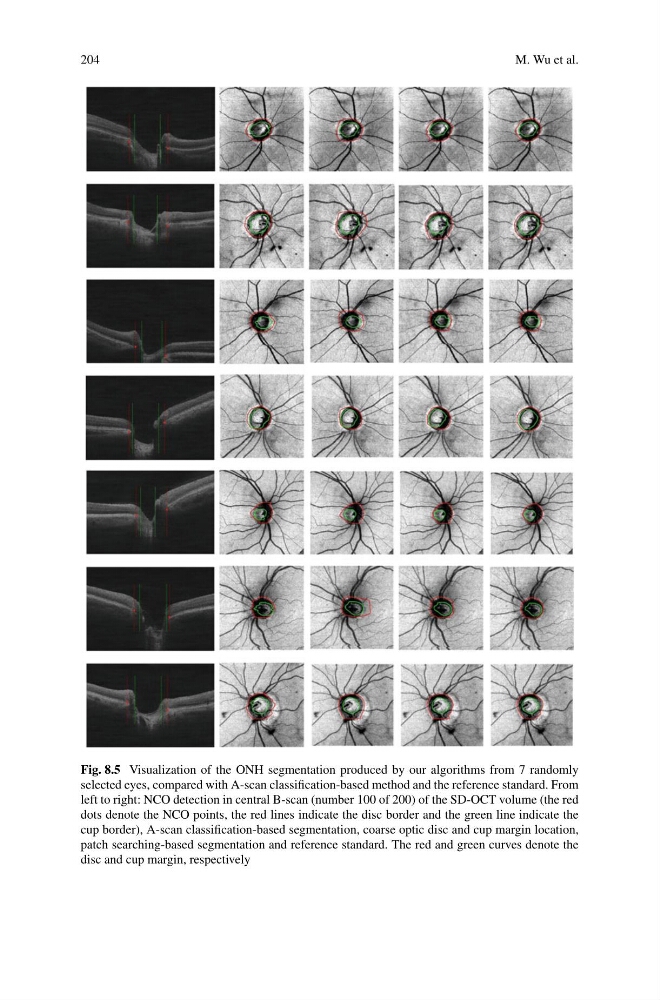
Fig. 8.5 Visualization of the ONH segmentation produced by our algorithms from 7 randomly
selected eyes, compared with A-scan classification-based method and the reference standard. From
left to right: NCO detection in central B-scan (number 100 of 200) of the SD-OCT volume (the red
dots denote the NCO points, the red lines indicate the disc border and the green line indicate the
cup border), A-scan classification-based segmentation, coarse optic disc and cup margin location,
patch searching-based segmentation and reference standard. The red and green curves denote the
disc and cup margin, respectively
M. Wu et al.
Fig. 8.5 Visualization of the ONH segmentation produced by our algorithms from 7 randomly
selected eyes, compared with A-scan classification-based method and the reference standard. From
left to right: NCO detection in central B-scan (number 100 of 200) of the SD-OCT volume (the red
dots denote the NCO points, the red lines indicate the disc border and the green line indicate the
cup border), A-scan classification-based segmentation, coarse optic disc and cup margin location,
patch searching-based segmentation and reference standard. The red and green curves denote the
disc and cup margin, respectively