

5 Segmentation of OCT Scans Using Probabilistic Graphical Models
119
5.3.2.3 Pathology Classification
Srinivasan et al. [27] published a dataset of 45 volumetric scans, composed of 15
healthy scans, and 15 scans affected by diabetic macular edema (DME) and agerelated macular degeneration (AMD) respectively. Since deformations for these
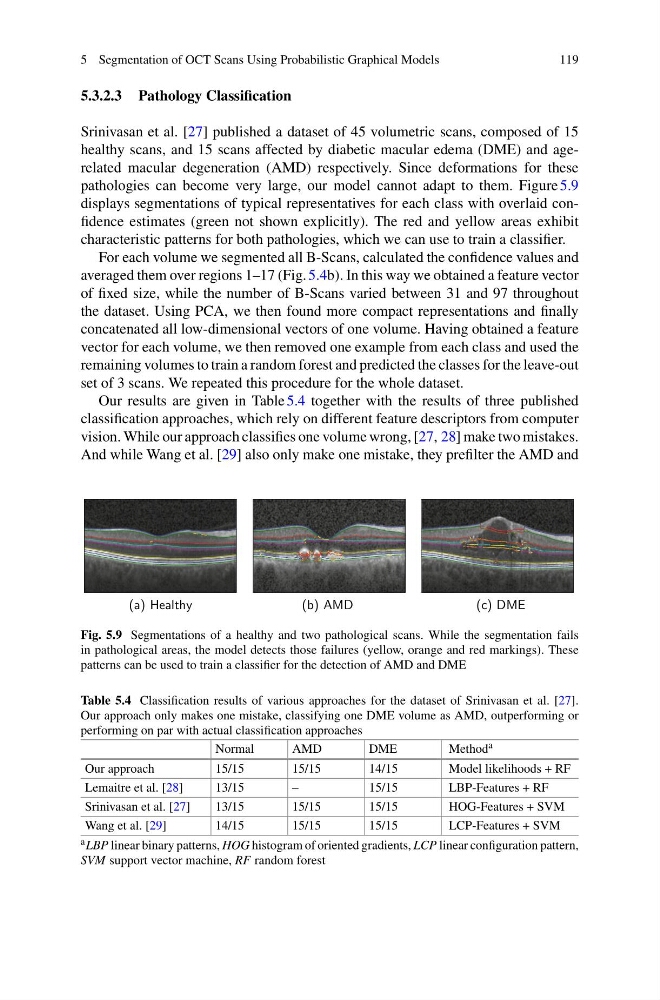
pathologies can become very large, our model cannot adapt to them. Figure 5.9
displays segmentations of typical representatives for each class with overlaid confidence estimates (green not shown explicitly). The red and yellow areas exhibit
characteristic patterns for both pathologies, which we can use to train a classifier.
For each volume we segmented all B-Scans, calculated the confidence values and
averaged them over regions 1–17 (Fig. 5.4b). In this way we obtained a feature vector
of fixed size, while the number of B-Scans varied between 31 and 97 throughout
the dataset. Using PCA, we then found more compact representations and finally
concatenated all low-dimensional vectors of one volume. Having obtained a feature
vector for each volume, we then removed one example from each class and used the
remaining volumes to train a random forest and predicted the classes for the leave-out
set of 3 scans. We repeated this procedure for the whole dataset.
Our results are given in Table 5.4 together with the results of three published
classification approaches, which rely on different feature descriptors from computer
vision. While our approach classifies one volume wrong, [27, 28] make two mistakes.
And while Wang et al. [29] also only make one mistake, they prefilter the AMD and
(a) Healthy
(b) AMD
(c) DME
Fig. 5.9 Segmentations of a healthy and two pathological scans. While the segmentation fails
in pathological areas, the model detects those failures (yellow, orange and red markings). These
patterns can be used to train a classifier for the detection of AMD and DME
Table 5.4 Classification results of various approaches for the dataset of Srinivasan et al. [27].
Our approach only makes one mistake, classifying one DME volume as AMD, outperforming or
performing on par with actual classification approaches
Normal
AMD
DME
Method a
Our approach
15/15
15/15
14/15
Model likelihoods + RF
Lemaitre et al. [28]
13/15
–
15/15
LBP-Features + RF
Srinivasan et al. [27]
13/15
15/15
15/15
HOG-Features + SVM
Wang et al. [29]
14/15
15/15
15/15
LCP-Features + SVM
a LBP linear binary patterns, HOG histogram of oriented gradients, LCP linear configuration pattern,
SVM support vector machine, RF random forest
119
5.3.2.3 Pathology Classification
Srinivasan et al. [27] published a dataset of 45 volumetric scans, composed of 15
healthy scans, and 15 scans affected by diabetic macular edema (DME) and agerelated macular degeneration (AMD) respectively. Since deformations for these
pathologies can become very large, our model cannot adapt to them. Figure 5.9
displays segmentations of typical representatives for each class with overlaid confidence estimates (green not shown explicitly). The red and yellow areas exhibit
characteristic patterns for both pathologies, which we can use to train a classifier.
For each volume we segmented all B-Scans, calculated the confidence values and
averaged them over regions 1–17 (Fig. 5.4b). In this way we obtained a feature vector
of fixed size, while the number of B-Scans varied between 31 and 97 throughout
the dataset. Using PCA, we then found more compact representations and finally
concatenated all low-dimensional vectors of one volume. Having obtained a feature
vector for each volume, we then removed one example from each class and used the
remaining volumes to train a random forest and predicted the classes for the leave-out
set of 3 scans. We repeated this procedure for the whole dataset.
Our results are given in Table 5.4 together with the results of three published
classification approaches, which rely on different feature descriptors from computer
vision. While our approach classifies one volume wrong, [27, 28] make two mistakes.
And while Wang et al. [29] also only make one mistake, they prefilter the AMD and
(a) Healthy
(b) AMD
(c) DME
Fig. 5.9 Segmentations of a healthy and two pathological scans. While the segmentation fails
in pathological areas, the model detects those failures (yellow, orange and red markings). These
patterns can be used to train a classifier for the detection of AMD and DME
Table 5.4 Classification results of various approaches for the dataset of Srinivasan et al. [27].
Our approach only makes one mistake, classifying one DME volume as AMD, outperforming or
performing on par with actual classification approaches
Normal
AMD
DME
Method a
Our approach
15/15
15/15
14/15
Model likelihoods + RF
Lemaitre et al. [28]
13/15
–
15/15
LBP-Features + RF
Srinivasan et al. [27]
13/15
15/15
15/15
HOG-Features + SVM
Wang et al. [29]
14/15
15/15
15/15
LCP-Features + SVM
a LBP linear binary patterns, HOG histogram of oriented gradients, LCP linear configuration pattern,
SVM support vector machine, RF random forest