

118
F. Rathke et al.
0
0.2
0.4
0.6
0.8
1
0
0.2
0.4
0.6
0.8
1
False Positive Rate
True Positive Rate
Average NFL
Temporal NFL
Global Shape
2
3
4
5
6
7
8
0
0.5
1
1.5
2
Unsigned Error in µm
Quality Index
Normal
Glaucoma
Fig. 5.7 Left: ROC curves for the two overall best performing NFL-based classifiers and our shape
prior based approach for the earliest stage of glaucoma. Right: High correlation of our quality
estimation index, obtained by comparing terms (c) and (e) from Fig. 5.6 to the actual unsigned error
Fig. 5.6a. We see a large correlation between both measures
(a)
(b)
(c)
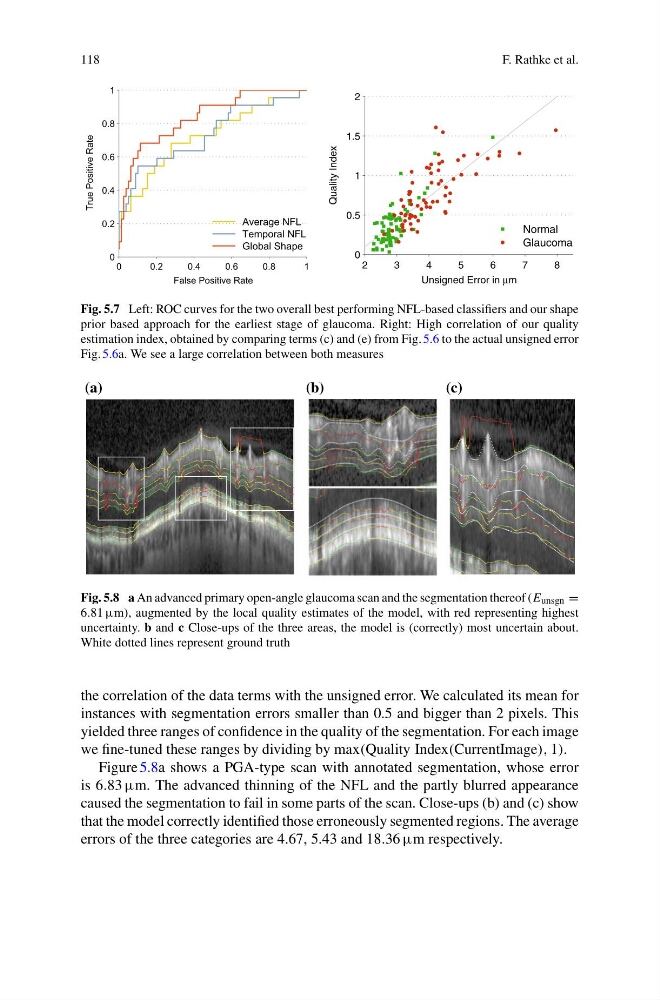
Fig. 5.8 a An advanced primary open-angle glaucoma scan and the segmentation thereof (E unsgn =
6.81 µm), augmented by the local quality estimates of the model, with red representing highest
uncertainty. b and c Close-ups of the three areas, the model is (correctly) most uncertain about.
White dotted lines represent ground truth
the correlation of the data terms with the unsigned error. We calculated its mean for
instances with segmentation errors smaller than 0.5 and bigger than 2 pixels. This
yielded three ranges of confidence in the quality of the segmentation. For each image
we fine-tuned these ranges by dividing by max(Quality Index(CurrentImage), 1).
Figure 5.8a shows a PGA-type scan with annotated segmentation, whose error
is 6.83 µm. The advanced thinning of the NFL and the partly blurred appearance
caused the segmentation to fail in some parts of the scan. Close-ups (b) and (c) show
that the model correctly identified those erroneously segmented regions. The average
errors of the three categories are 4.67, 5.43 and 18.36 µm respectively.
F. Rathke et al.
0
0.2
0.4
0.6
0.8
1
0
0.2
0.4
0.6
0.8
1
False Positive Rate
True Positive Rate
Average NFL
Temporal NFL
Global Shape
2
3
4
5
6
7
8
0
0.5
1
1.5
2
Unsigned Error in µm
Quality Index
Normal
Glaucoma
Fig. 5.7 Left: ROC curves for the two overall best performing NFL-based classifiers and our shape
prior based approach for the earliest stage of glaucoma. Right: High correlation of our quality
estimation index, obtained by comparing terms (c) and (e) from Fig. 5.6 to the actual unsigned error
Fig. 5.6a. We see a large correlation between both measures
(a)
(b)
(c)
Fig. 5.8 a An advanced primary open-angle glaucoma scan and the segmentation thereof (E unsgn =
6.81 µm), augmented by the local quality estimates of the model, with red representing highest
uncertainty. b and c Close-ups of the three areas, the model is (correctly) most uncertain about.
White dotted lines represent ground truth
the correlation of the data terms with the unsigned error. We calculated its mean for
instances with segmentation errors smaller than 0.5 and bigger than 2 pixels. This
yielded three ranges of confidence in the quality of the segmentation. For each image
we fine-tuned these ranges by dividing by max(Quality Index(CurrentImage), 1).
Figure 5.8a shows a PGA-type scan with annotated segmentation, whose error
is 6.83 µm. The advanced thinning of the NFL and the partly blurred appearance
caused the segmentation to fail in some parts of the scan. Close-ups (b) and (c) show
that the model correctly identified those erroneously segmented regions. The average
errors of the three categories are 4.67, 5.43 and 18.36 µm respectively.