

5 Segmentation of OCT Scans Using Probabilistic Graphical Models
117
H P E M A
2
3
4
5
6
7
8
Unsigned Error
(a)
H P E M A
Singleton
(b)
H P E M A
Mutual
(c)
H P E M A
Data
(d)
H P E M A
Shape
(e)
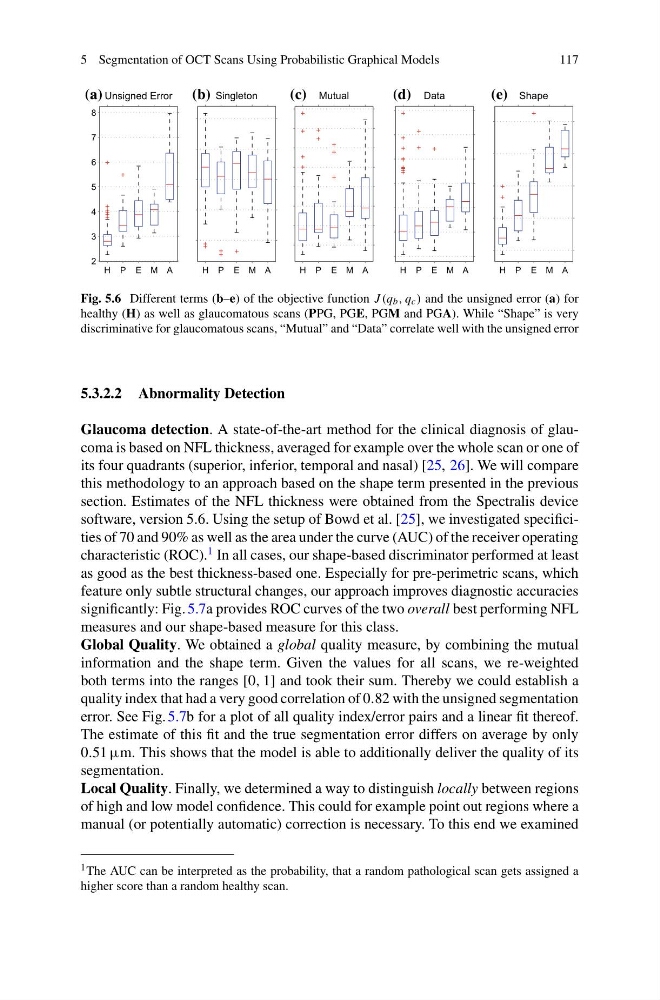
Fig. 5.6 Different terms (b–e) of the objective function J (q b , q c ) and the unsigned error (a) for
healthy (H) as well as glaucomatous scans (PPG, PGE, PGM and PGA). While “Shape” is very
discriminative for glaucomatous scans, “Mutual” and “Data” correlate well with the unsigned error
5.3.2.2 Abnormality Detection
Glaucoma detection. A state-of-the-art method for the clinical diagnosis of glaucoma is based on NFL thickness, averaged for example over the whole scan or one of
its four quadrants (superior, inferior, temporal and nasal) [25, 26]. We will compare
this methodology to an approach based on the shape term presented in the previous
section. Estimates of the NFL thickness were obtained from the Spectralis device
software, version 5.6. Using the setup of Bowd et al. [25], we investigated specificities of 70 and 90% as well as the area under the curve (AUC) of the receiver operating
characteristic (ROC).
1 In all cases, our shape-based discriminator performed at least
as good as the best thickness-based one. Especially for pre-perimetric scans, which
feature only subtle structural changes, our approach improves diagnostic accuracies
significantly: Fig. 5.7a provides ROC curves of the two overall best performing NFL
measures and our shape-based measure for this class.
Global Quality. We obtained a global quality measure, by combining the mutual
information and the shape term. Given the values for all scans, we re-weighted
both terms into the ranges [0, 1] and took their sum. Thereby we could establish a
quality index that had a very good correlation of 0.82 with the unsigned segmentation
error. See Fig. 5.7b for a plot of all quality index/error pairs and a linear fit thereof.
The estimate of this fit and the true segmentation error differs on average by only
0.51 µm. This shows that the model is able to additionally deliver the quality of its
segmentation.
Local Quality. Finally, we determined a way to distinguish locally between regions
of high and low model confidence. This could for example point out regions where a
manual (or potentially automatic) correction is necessary. To this end we examined
1 The AUC can be interpreted as the probability, that a random pathological scan gets assigned a
higher score than a random healthy scan.
117
H P E M A
2
3
4
5
6
7
8
Unsigned Error
(a)
H P E M A
Singleton
(b)
H P E M A
Mutual
(c)
H P E M A
Data
(d)
H P E M A
Shape
(e)
Fig. 5.6 Different terms (b–e) of the objective function J (q b , q c ) and the unsigned error (a) for
healthy (H) as well as glaucomatous scans (PPG, PGE, PGM and PGA). While “Shape” is very
discriminative for glaucomatous scans, “Mutual” and “Data” correlate well with the unsigned error
5.3.2.2 Abnormality Detection
Glaucoma detection. A state-of-the-art method for the clinical diagnosis of glaucoma is based on NFL thickness, averaged for example over the whole scan or one of
its four quadrants (superior, inferior, temporal and nasal) [25, 26]. We will compare
this methodology to an approach based on the shape term presented in the previous
section. Estimates of the NFL thickness were obtained from the Spectralis device
software, version 5.6. Using the setup of Bowd et al. [25], we investigated specificities of 70 and 90% as well as the area under the curve (AUC) of the receiver operating
characteristic (ROC).
1 In all cases, our shape-based discriminator performed at least
as good as the best thickness-based one. Especially for pre-perimetric scans, which
feature only subtle structural changes, our approach improves diagnostic accuracies
significantly: Fig. 5.7a provides ROC curves of the two overall best performing NFL
measures and our shape-based measure for this class.
Global Quality. We obtained a global quality measure, by combining the mutual
information and the shape term. Given the values for all scans, we re-weighted
both terms into the ranges [0, 1] and took their sum. Thereby we could establish a
quality index that had a very good correlation of 0.82 with the unsigned segmentation
error. See Fig. 5.7b for a plot of all quality index/error pairs and a linear fit thereof.
The estimate of this fit and the true segmentation error differs on average by only
0.51 µm. This shows that the model is able to additionally deliver the quality of its
segmentation.
Local Quality. Finally, we determined a way to distinguish locally between regions
of high and low model confidence. This could for example point out regions where a
manual (or potentially automatic) correction is necessary. To this end we examined
1 The AUC can be interpreted as the probability, that a random pathological scan gets assigned a
higher score than a random healthy scan.