

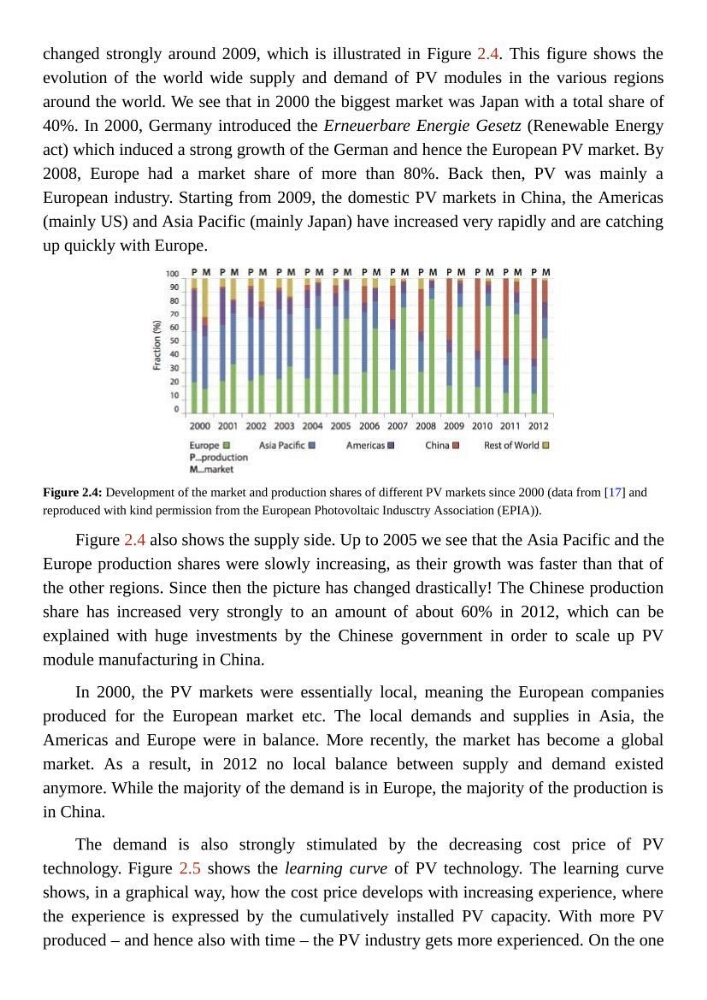
changed strongly around 2009, which is illustrated in Figure 2.4. This figure shows the
evolution of the world wide supply and demand of PV modules in the various regions
around the world. We see that in 2000 the biggest market was Japan with a total share of
40%. In 2000, Germany introduced the Erneuerbare Energie Gesetz (Renewable Energy
act) which induced a strong growth of the German and hence the European PV market. By
2008, Europe had a market share of more than 80%. Back then, PV was mainly a
European industry. Starting from 2009, the domestic PV markets in China, the Americas
(mainly US) and Asia Pacific (mainly Japan) have increased very rapidly and are catching
up quickly with Europe.
Figure 2.4: Development of the market and production shares of different PV markets since 2000 (data from [17] and
reproduced with kind permission from the European Photovoltaic Indusctry Association (EPIA)).
Figure 2.4 also shows the supply side. Up to 2005 we see that the Asia Pacific and the
Europe production shares were slowly increasing, as their growth was faster than that of
the other regions. Since then the picture has changed drastically! The Chinese production
share has increased very strongly to an amount of about 60% in 2012, which can be
explained with huge investments by the Chinese government in order to scale up PV
module manufacturing in China.
In 2000, the PV markets were essentially local, meaning the European companies
produced for the European market etc. The local demands and supplies in Asia, the
Americas and Europe were in balance. More recently, the market has become a global
market. As a result, in 2012 no local balance between supply and demand existed
anymore. While the majority of the demand is in Europe, the majority of the production is
in China.
The demand is also strongly stimulated by the decreasing cost price of PV
technology. Figure 2.5 shows the learning curve of PV technology. The learning curve
shows, in a graphical way, how the cost price develops with increasing experience, where
the experience is expressed by the cumulatively installed PV capacity. With more PV
produced – and hence also with time – the PV industry gets more experienced. On the one
evolution of the world wide supply and demand of PV modules in the various regions
around the world. We see that in 2000 the biggest market was Japan with a total share of
40%. In 2000, Germany introduced the Erneuerbare Energie Gesetz (Renewable Energy
act) which induced a strong growth of the German and hence the European PV market. By
2008, Europe had a market share of more than 80%. Back then, PV was mainly a
European industry. Starting from 2009, the domestic PV markets in China, the Americas
(mainly US) and Asia Pacific (mainly Japan) have increased very rapidly and are catching
up quickly with Europe.
Figure 2.4: Development of the market and production shares of different PV markets since 2000 (data from [17] and
reproduced with kind permission from the European Photovoltaic Indusctry Association (EPIA)).
Figure 2.4 also shows the supply side. Up to 2005 we see that the Asia Pacific and the
Europe production shares were slowly increasing, as their growth was faster than that of
the other regions. Since then the picture has changed drastically! The Chinese production
share has increased very strongly to an amount of about 60% in 2012, which can be
explained with huge investments by the Chinese government in order to scale up PV
module manufacturing in China.
In 2000, the PV markets were essentially local, meaning the European companies
produced for the European market etc. The local demands and supplies in Asia, the
Americas and Europe were in balance. More recently, the market has become a global
market. As a result, in 2012 no local balance between supply and demand existed
anymore. While the majority of the demand is in Europe, the majority of the production is
in China.
The demand is also strongly stimulated by the decreasing cost price of PV
technology. Figure 2.5 shows the learning curve of PV technology. The learning curve
shows, in a graphical way, how the cost price develops with increasing experience, where
the experience is expressed by the cumulatively installed PV capacity. With more PV
produced – and hence also with time – the PV industry gets more experienced. On the one