

29%. It will be interesting to see how this development continues in the coming years.
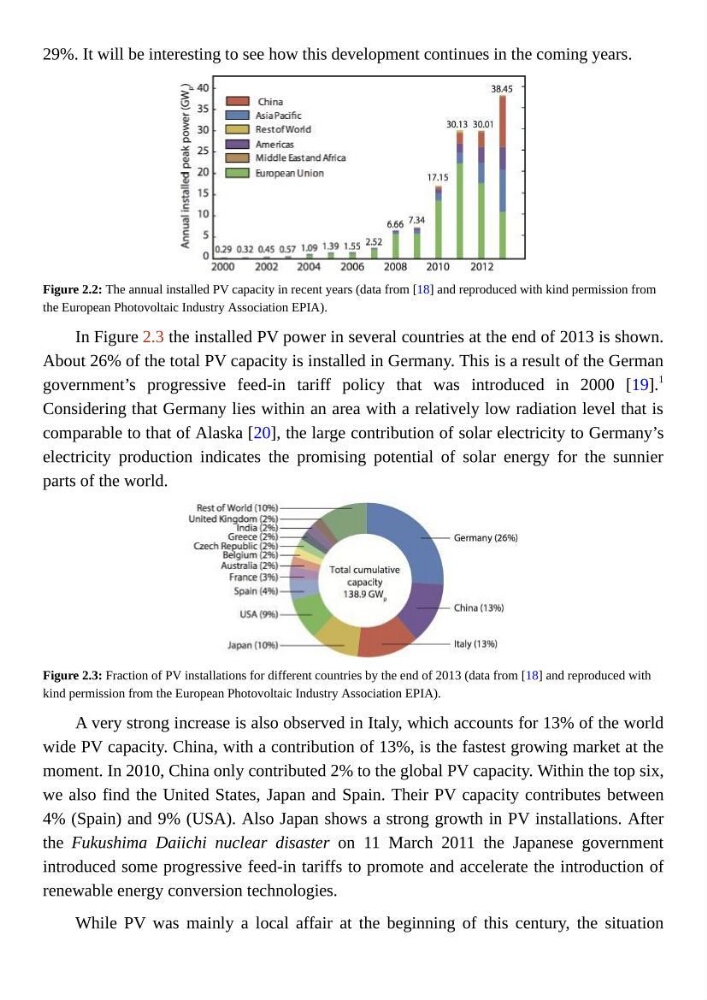
Figure 2.2: The annual installed PV capacity in recent years (data from [18] and reproduced with kind permission from
the European Photovoltaic Industry Association EPIA).
In Figure 2.3 the installed PV power in several countries at the end of 2013 is shown.
About 26% of the total PV capacity is installed in Germany. This is a result of the German
government’s progressive feed-in tariff policy that was introduced in 2000 [19].
1
Considering that Germany lies within an area with a relatively low radiation level that is
comparable to that of Alaska [20], the large contribution of solar electricity to Germany’s
electricity production indicates the promising potential of solar energy for the sunnier
parts of the world.
Figure 2.3: Fraction of PV installations for different countries by the end of 2013 (data from [18] and reproduced with
kind permission from the European Photovoltaic Industry Association EPIA).
A very strong increase is also observed in Italy, which accounts for 13% of the world
wide PV capacity. China, with a contribution of 13%, is the fastest growing market at the
moment. In 2010, China only contributed 2% to the global PV capacity. Within the top six,
we also find the United States, Japan and Spain. Their PV capacity contributes between
4% (Spain) and 9% (USA). Also Japan shows a strong growth in PV installations. After
the Fukushima Daiichi nuclear disaster on 11 March 2011 the Japanese government
introduced some progressive feed-in tariffs to promote and accelerate the introduction of
renewable energy conversion technologies.
While PV was mainly a local affair at the beginning of this century, the situation
Figure 2.2: The annual installed PV capacity in recent years (data from [18] and reproduced with kind permission from
the European Photovoltaic Industry Association EPIA).
In Figure 2.3 the installed PV power in several countries at the end of 2013 is shown.
About 26% of the total PV capacity is installed in Germany. This is a result of the German
government’s progressive feed-in tariff policy that was introduced in 2000 [19].
1
Considering that Germany lies within an area with a relatively low radiation level that is
comparable to that of Alaska [20], the large contribution of solar electricity to Germany’s
electricity production indicates the promising potential of solar energy for the sunnier
parts of the world.
Figure 2.3: Fraction of PV installations for different countries by the end of 2013 (data from [18] and reproduced with
kind permission from the European Photovoltaic Industry Association EPIA).
A very strong increase is also observed in Italy, which accounts for 13% of the world
wide PV capacity. China, with a contribution of 13%, is the fastest growing market at the
moment. In 2010, China only contributed 2% to the global PV capacity. Within the top six,
we also find the United States, Japan and Spain. Their PV capacity contributes between
4% (Spain) and 9% (USA). Also Japan shows a strong growth in PV installations. After
the Fukushima Daiichi nuclear disaster on 11 March 2011 the Japanese government
introduced some progressive feed-in tariffs to promote and accelerate the introduction of
renewable energy conversion technologies.
While PV was mainly a local affair at the beginning of this century, the situation