

P AC :
P DC :
V DC :
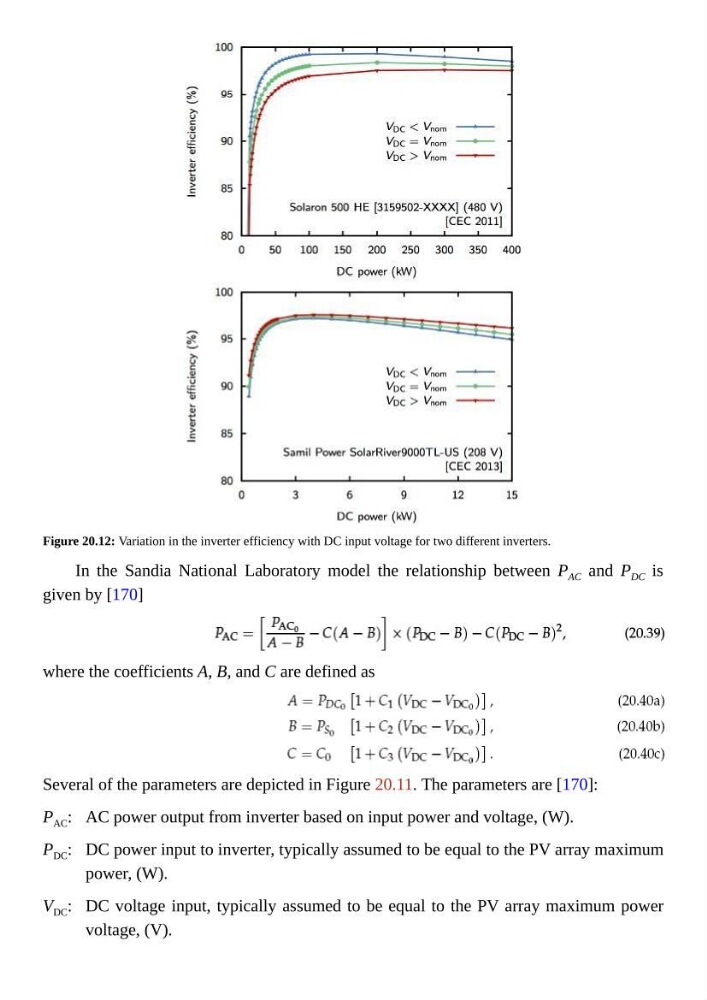
Figure 20.12: Variation in the inverter efficiency with DC input voltage for two different inverters.
In the Sandia National Laboratory model the relationship between P AC and P DC is
given by [170]
where the coefficients A, B, and C are defined as
Several of the parameters are depicted in Figure 20.11. The parameters are [170]:
AC power output from inverter based on input power and voltage, (W).
DC power input to inverter, typically assumed to be equal to the PV array maximum
power, (W).
DC voltage input, typically assumed to be equal to the PV array maximum power
voltage, (V).
P DC :
V DC :
Figure 20.12: Variation in the inverter efficiency with DC input voltage for two different inverters.
In the Sandia National Laboratory model the relationship between P AC and P DC is
given by [170]
where the coefficients A, B, and C are defined as
Several of the parameters are depicted in Figure 20.11. The parameters are [170]:
AC power output from inverter based on input power and voltage, (W).
DC power input to inverter, typically assumed to be equal to the PV array maximum
power, (W).
DC voltage input, typically assumed to be equal to the PV array maximum power
voltage, (V).