

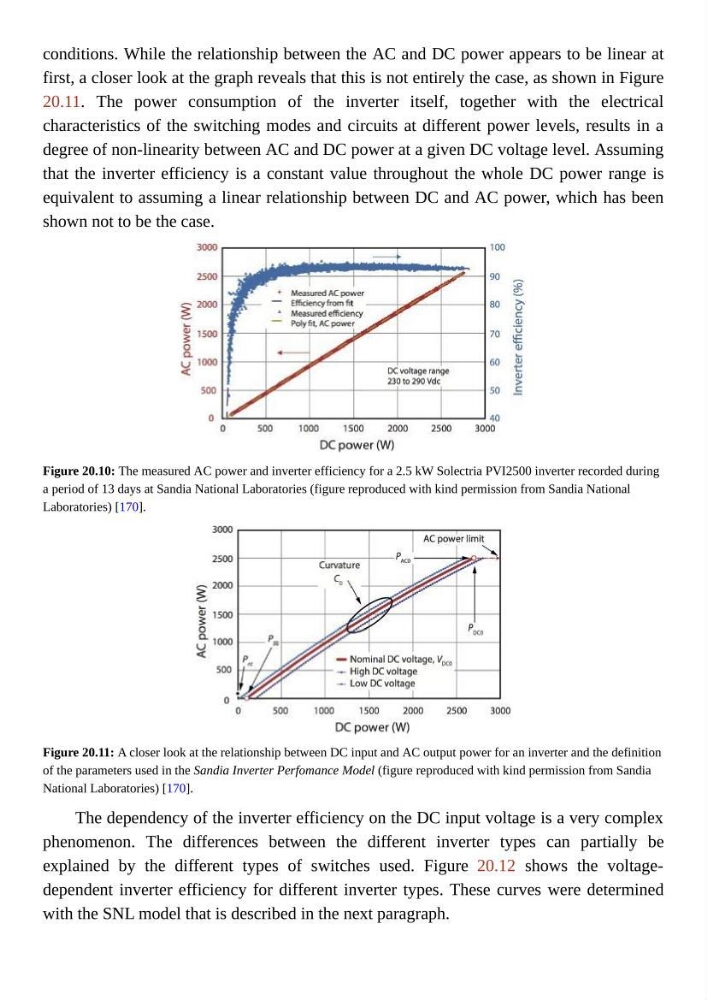
conditions. While the relationship between the AC and DC power appears to be linear at
first, a closer look at the graph reveals that this is not entirely the case, as shown in Figure
20.11. The power consumption of the inverter itself, together with the electrical
characteristics of the switching modes and circuits at different power levels, results in a
degree of non-linearity between AC and DC power at a given DC voltage level. Assuming
that the inverter efficiency is a constant value throughout the whole DC power range is
equivalent to assuming a linear relationship between DC and AC power, which has been
shown not to be the case.
Figure 20.10: The measured AC power and inverter efficiency for a 2.5 kW Solectria PVI2500 inverter recorded during
a period of 13 days at Sandia National Laboratories (figure reproduced with kind permission from Sandia National
Laboratories) [170].
Figure 20.11: A closer look at the relationship between DC input and AC output power for an inverter and the definition
of the parameters used in the Sandia Inverter Perfomance Model (figure reproduced with kind permission from Sandia
National Laboratories) [170].
The dependency of the inverter efficiency on the DC input voltage is a very complex
phenomenon. The differences between the different inverter types can partially be
explained by the different types of switches used. Figure 20.12 shows the voltagedependent inverter efficiency for different inverter types. These curves were determined
with the SNL model that is described in the next paragraph.
first, a closer look at the graph reveals that this is not entirely the case, as shown in Figure
20.11. The power consumption of the inverter itself, together with the electrical
characteristics of the switching modes and circuits at different power levels, results in a
degree of non-linearity between AC and DC power at a given DC voltage level. Assuming
that the inverter efficiency is a constant value throughout the whole DC power range is
equivalent to assuming a linear relationship between DC and AC power, which has been
shown not to be the case.
Figure 20.10: The measured AC power and inverter efficiency for a 2.5 kW Solectria PVI2500 inverter recorded during
a period of 13 days at Sandia National Laboratories (figure reproduced with kind permission from Sandia National
Laboratories) [170].
Figure 20.11: A closer look at the relationship between DC input and AC output power for an inverter and the definition
of the parameters used in the Sandia Inverter Perfomance Model (figure reproduced with kind permission from Sandia
National Laboratories) [170].
The dependency of the inverter efficiency on the DC input voltage is a very complex
phenomenon. The differences between the different inverter types can partially be
explained by the different types of switches used. Figure 20.12 shows the voltagedependent inverter efficiency for different inverter types. These curves were determined
with the SNL model that is described in the next paragraph.