

into the electricity grid.
In order not to waste electricity produced by the PV array, an inverter should always
work as close as possible to its maximum achievable efficiency. However, the inverter
efficiency is not a constant, but strongly depends on the DC input voltage and the total DC
input power. The inverter efficiency η inv with respect to the input DC power at various DC
voltage levels is usually given in the data sheet, at least for some values. Sometimes, only
a peak value is given.
Weighted efficiencies
A more reliable way of expressing the inverter efficiency in a single number is to use
weighted efficiencies, which combine the inverter efficiencies over a wide range of solar
resource regimes [169]. Two different weighted efficiencies are commonly used. First, the
European efficiency, which represents a low insolation climate such as in Central Europe,
and second, the California Energy Commission (CEC) efficiency, which represents the PV
system performance in high insolation regions such as in the southwest of the United
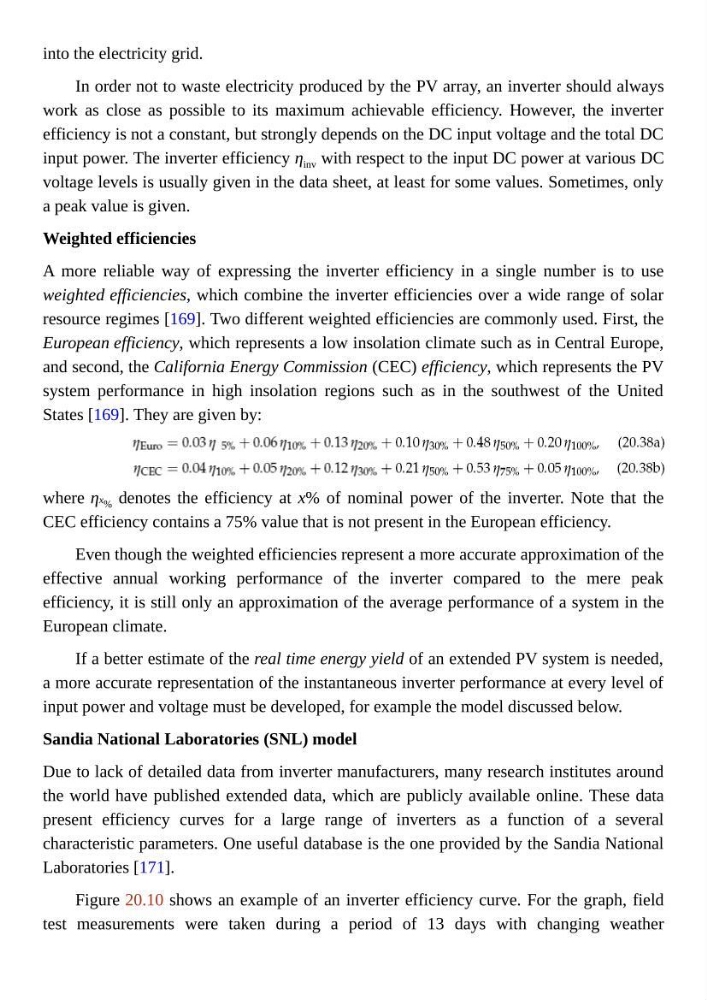
States [169]. They are given by:
where ηx % denotes the efficiency at x% of nominal power of the inverter. Note that the
CEC efficiency contains a 75% value that is not present in the European efficiency.
Even though the weighted efficiencies represent a more accurate approximation of the
effective annual working performance of the inverter compared to the mere peak
efficiency, it is still only an approximation of the average performance of a system in the
European climate.
If a better estimate of the real time energy yield of an extended PV system is needed,
a more accurate representation of the instantaneous inverter performance at every level of
input power and voltage must be developed, for example the model discussed below.
Sandia National Laboratories (SNL) model
Due to lack of detailed data from inverter manufacturers, many research institutes around
the world have published extended data, which are publicly available online. These data
present efficiency curves for a large range of inverters as a function of a several
characteristic parameters. One useful database is the one provided by the Sandia National
Laboratories [171].
Figure 20.10 shows an example of an inverter efficiency curve. For the graph, field
test measurements were taken during a period of 13 days with changing weather
In order not to waste electricity produced by the PV array, an inverter should always
work as close as possible to its maximum achievable efficiency. However, the inverter
efficiency is not a constant, but strongly depends on the DC input voltage and the total DC
input power. The inverter efficiency η inv with respect to the input DC power at various DC
voltage levels is usually given in the data sheet, at least for some values. Sometimes, only
a peak value is given.
Weighted efficiencies
A more reliable way of expressing the inverter efficiency in a single number is to use
weighted efficiencies, which combine the inverter efficiencies over a wide range of solar
resource regimes [169]. Two different weighted efficiencies are commonly used. First, the
European efficiency, which represents a low insolation climate such as in Central Europe,
and second, the California Energy Commission (CEC) efficiency, which represents the PV
system performance in high insolation regions such as in the southwest of the United
States [169]. They are given by:
where ηx % denotes the efficiency at x% of nominal power of the inverter. Note that the
CEC efficiency contains a 75% value that is not present in the European efficiency.
Even though the weighted efficiencies represent a more accurate approximation of the
effective annual working performance of the inverter compared to the mere peak
efficiency, it is still only an approximation of the average performance of a system in the
European climate.
If a better estimate of the real time energy yield of an extended PV system is needed,
a more accurate representation of the instantaneous inverter performance at every level of
input power and voltage must be developed, for example the model discussed below.
Sandia National Laboratories (SNL) model
Due to lack of detailed data from inverter manufacturers, many research institutes around
the world have published extended data, which are publicly available online. These data
present efficiency curves for a large range of inverters as a function of a several
characteristic parameters. One useful database is the one provided by the Sandia National
Laboratories [171].
Figure 20.10 shows an example of an inverter efficiency curve. For the graph, field
test measurements were taken during a period of 13 days with changing weather