

20.2
irradiation throughout the year, i.e. regions that are in the proximity of the Equator. As we
move further away from the equator, differences between the length of the day in summer
and winter become larger. As a consequence, the difference between the daily sun hours in
winter and summer also becomes larger. To account for this effect, the system can be sized
such that it delivers sufficient energy in the worst month, i.e. December or January in the
northern hemisphere. However, this may make the system very large and significantly
oversized during the summer months, which makes it less economical. In general we can
say that designing off-grid systems becomes more difficult the further we are away from
the Equator.
Load profiles
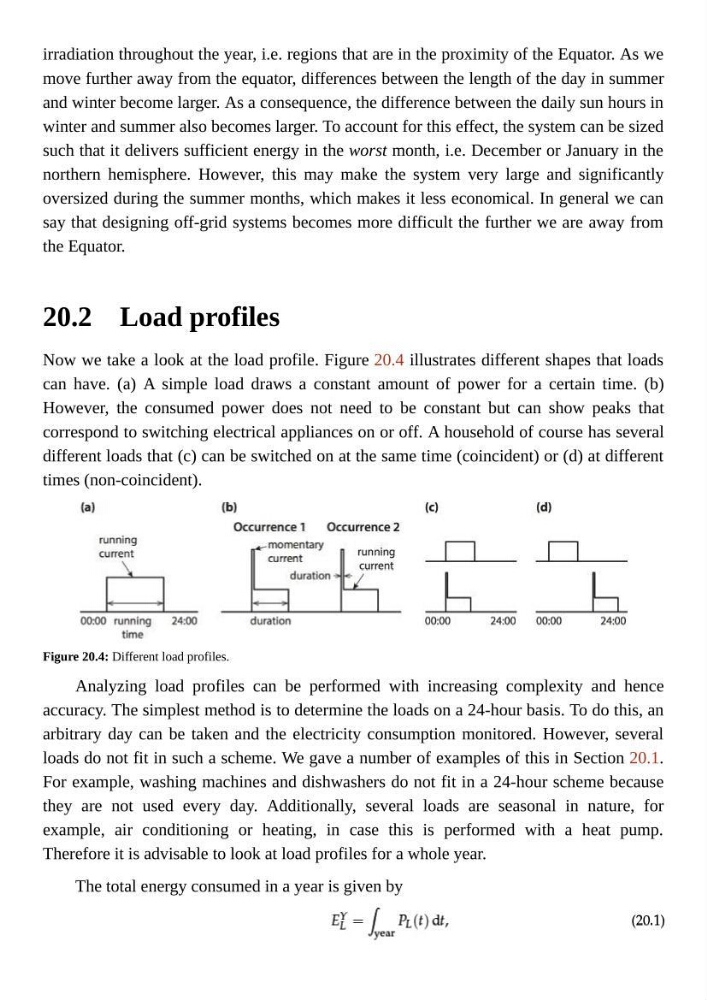
Now we take a look at the load profile. Figure 20.4 illustrates different shapes that loads
can have. (a) A simple load draws a constant amount of power for a certain time. (b)
However, the consumed power does not need to be constant but can show peaks that
correspond to switching electrical appliances on or off. A household of course has several
different loads that (c) can be switched on at the same time (coincident) or (d) at different
times (non-coincident).
Figure 20.4: Different load profiles.
Analyzing load profiles can be performed with increasing complexity and hence
accuracy. The simplest method is to determine the loads on a 24-hour basis. To do this, an
arbitrary day can be taken and the electricity consumption monitored. However, several
loads do not fit in such a scheme. We gave a number of examples of this in Section 20.1.
For example, washing machines and dishwashers do not fit in a 24-hour scheme because
they are not used every day. Additionally, several loads are seasonal in nature, for
example, air conditioning or heating, in case this is performed with a heat pump.
Therefore it is advisable to look at load profiles for a whole year.
The total energy consumed in a year is given by
irradiation throughout the year, i.e. regions that are in the proximity of the Equator. As we
move further away from the equator, differences between the length of the day in summer
and winter become larger. As a consequence, the difference between the daily sun hours in
winter and summer also becomes larger. To account for this effect, the system can be sized
such that it delivers sufficient energy in the worst month, i.e. December or January in the
northern hemisphere. However, this may make the system very large and significantly
oversized during the summer months, which makes it less economical. In general we can
say that designing off-grid systems becomes more difficult the further we are away from
the Equator.
Load profiles
Now we take a look at the load profile. Figure 20.4 illustrates different shapes that loads
can have. (a) A simple load draws a constant amount of power for a certain time. (b)
However, the consumed power does not need to be constant but can show peaks that
correspond to switching electrical appliances on or off. A household of course has several
different loads that (c) can be switched on at the same time (coincident) or (d) at different
times (non-coincident).
Figure 20.4: Different load profiles.
Analyzing load profiles can be performed with increasing complexity and hence
accuracy. The simplest method is to determine the loads on a 24-hour basis. To do this, an
arbitrary day can be taken and the electricity consumption monitored. However, several
loads do not fit in such a scheme. We gave a number of examples of this in Section 20.1.
For example, washing machines and dishwashers do not fit in a 24-hour scheme because
they are not used every day. Additionally, several loads are seasonal in nature, for
example, air conditioning or heating, in case this is performed with a heat pump.
Therefore it is advisable to look at load profiles for a whole year.
The total energy consumed in a year is given by