

20.3
20.3.1
where P L (t) is the power of the load at time t. is expressed in kWh/year.
Meteorological effects
Standard test conditions (STC) of photovoltaic (PV) modules are not generally
representative of the real working conditions of a solar module. For example, high levels
of irradiance on the PV module G M may cause the temperature T M of a PV module to rise
many degrees above the STC temperature of 25 °C. This leads to a lower module voltage
and hence output power. On the other hand, in a climate such as the one in the
Netherlands, real operating conditions for PV systems correspond to relatively low levels
of irradiance combined with a cold and windy weather.
When designing a PV system, it is very important to estimate the effect of the module
temperature and the irradiance onto the PV module performance. In this section we first
introduce simple models to estimate the solar cell temperature T M .
2
Then we discuss the
effect of temperature and irradiance G M on the PV module performance. Finally, we
develop expressions to estimate the overall performance of PV modules under given
temperature and irradiance conditions.
Simplified thermal models for a PV array
The temperature strongly influences the performance of a PV module. While the level of
incident irradiation can be easily measured with a pyranometer, the temperature of a solar
cell inside a PV module is much harder to evaluate. In order to give an estimate of the
average cell temperature, solar manufacturers provide, together with rated performances at
STC, the so-called nominal operating cell temperature (NOCT). This value corresponds to
the temperature of a solar cell under an irradiance level of 800 W/m
2
, ambient temperature
of 20 °C and an external wind speed of 1 m/s [161–163].
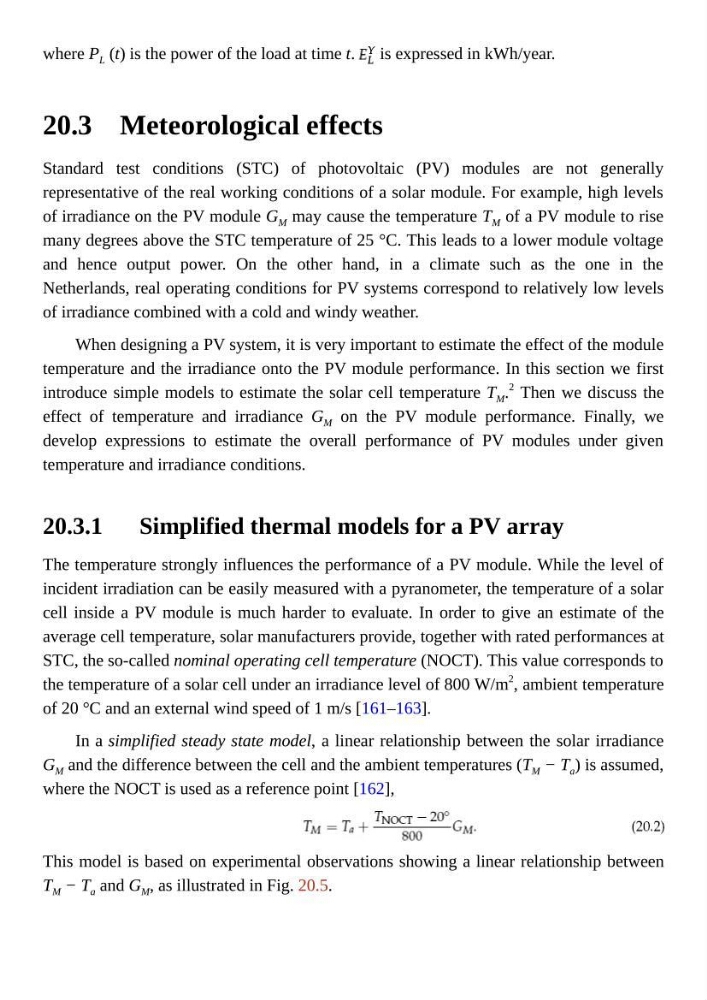
In a simplified steady state model, a linear relationship between the solar irradiance
G M and the difference between the cell and the ambient temperatures (T M − T a ) is assumed,
where the NOCT is used as a reference point [162],
This model is based on experimental observations showing a linear relationship between
T M − T a and G M , as illustrated in Fig. 20.5.
20.3.1
where P L (t) is the power of the load at time t. is expressed in kWh/year.
Meteorological effects
Standard test conditions (STC) of photovoltaic (PV) modules are not generally
representative of the real working conditions of a solar module. For example, high levels
of irradiance on the PV module G M may cause the temperature T M of a PV module to rise
many degrees above the STC temperature of 25 °C. This leads to a lower module voltage
and hence output power. On the other hand, in a climate such as the one in the
Netherlands, real operating conditions for PV systems correspond to relatively low levels
of irradiance combined with a cold and windy weather.
When designing a PV system, it is very important to estimate the effect of the module
temperature and the irradiance onto the PV module performance. In this section we first
introduce simple models to estimate the solar cell temperature T M .
2
Then we discuss the
effect of temperature and irradiance G M on the PV module performance. Finally, we
develop expressions to estimate the overall performance of PV modules under given
temperature and irradiance conditions.
Simplified thermal models for a PV array
The temperature strongly influences the performance of a PV module. While the level of
incident irradiation can be easily measured with a pyranometer, the temperature of a solar
cell inside a PV module is much harder to evaluate. In order to give an estimate of the
average cell temperature, solar manufacturers provide, together with rated performances at
STC, the so-called nominal operating cell temperature (NOCT). This value corresponds to
the temperature of a solar cell under an irradiance level of 800 W/m
2
, ambient temperature
of 20 °C and an external wind speed of 1 m/s [161–163].
In a simplified steady state model, a linear relationship between the solar irradiance
G M and the difference between the cell and the ambient temperatures (T M − T a ) is assumed,
where the NOCT is used as a reference point [162],
This model is based on experimental observations showing a linear relationship between
T M − T a and G M , as illustrated in Fig. 20.5.