

will act as the middle cell and junction 3 will act as the bottom cell.
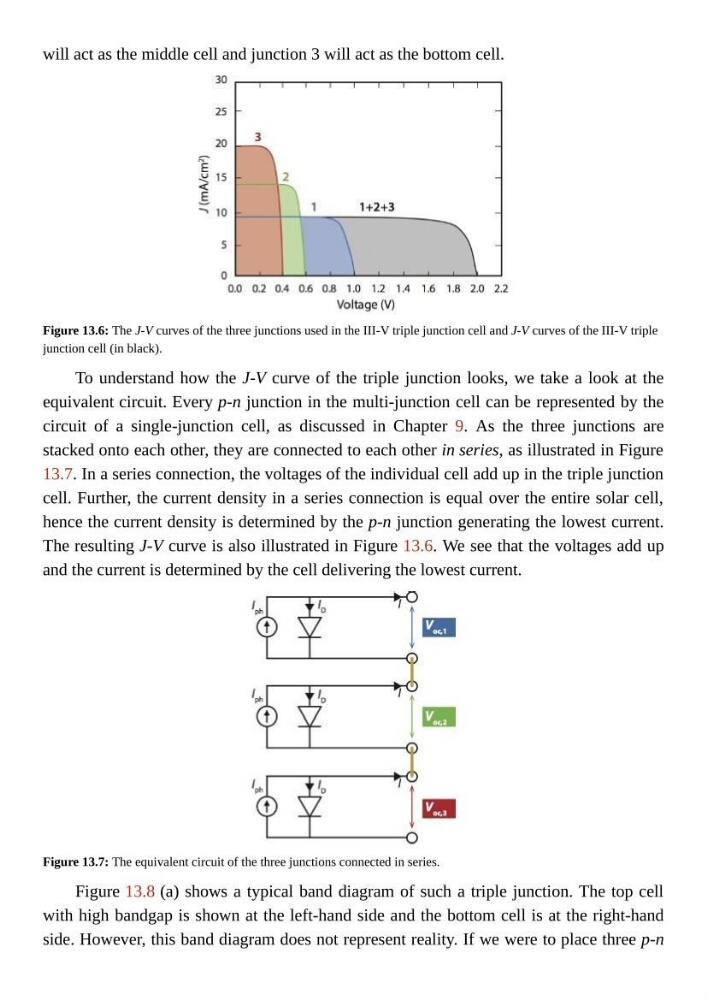
Figure 13.6: The J-V curves of the three junctions used in the III-V triple junction cell and J-V curves of the III-V triple
junction cell (in black).
To understand how the J-V curve of the triple junction looks, we take a look at the
equivalent circuit. Every p-n junction in the multi-junction cell can be represented by the
circuit of a single-junction cell, as discussed in Chapter 9. As the three junctions are
stacked onto each other, they are connected to each other in series, as illustrated in Figure
13.7. In a series connection, the voltages of the individual cell add up in the triple junction
cell. Further, the current density in a series connection is equal over the entire solar cell,
hence the current density is determined by the p-n junction generating the lowest current.
The resulting J-V curve is also illustrated in Figure 13.6. We see that the voltages add up
and the current is determined by the cell delivering the lowest current.
Figure 13.7: The equivalent circuit of the three junctions connected in series.
Figure 13.8 (a) shows a typical band diagram of such a triple junction. The top cell
with high bandgap is shown at the left-hand side and the bottom cell is at the right-hand
side. However, this band diagram does not represent reality. If we were to place three p-n
Figure 13.6: The J-V curves of the three junctions used in the III-V triple junction cell and J-V curves of the III-V triple
junction cell (in black).
To understand how the J-V curve of the triple junction looks, we take a look at the
equivalent circuit. Every p-n junction in the multi-junction cell can be represented by the
circuit of a single-junction cell, as discussed in Chapter 9. As the three junctions are
stacked onto each other, they are connected to each other in series, as illustrated in Figure
13.7. In a series connection, the voltages of the individual cell add up in the triple junction
cell. Further, the current density in a series connection is equal over the entire solar cell,
hence the current density is determined by the p-n junction generating the lowest current.
The resulting J-V curve is also illustrated in Figure 13.6. We see that the voltages add up
and the current is determined by the cell delivering the lowest current.
Figure 13.7: The equivalent circuit of the three junctions connected in series.
Figure 13.8 (a) shows a typical band diagram of such a triple junction. The top cell
with high bandgap is shown at the left-hand side and the bottom cell is at the right-hand
side. However, this band diagram does not represent reality. If we were to place three p-n