

13.2
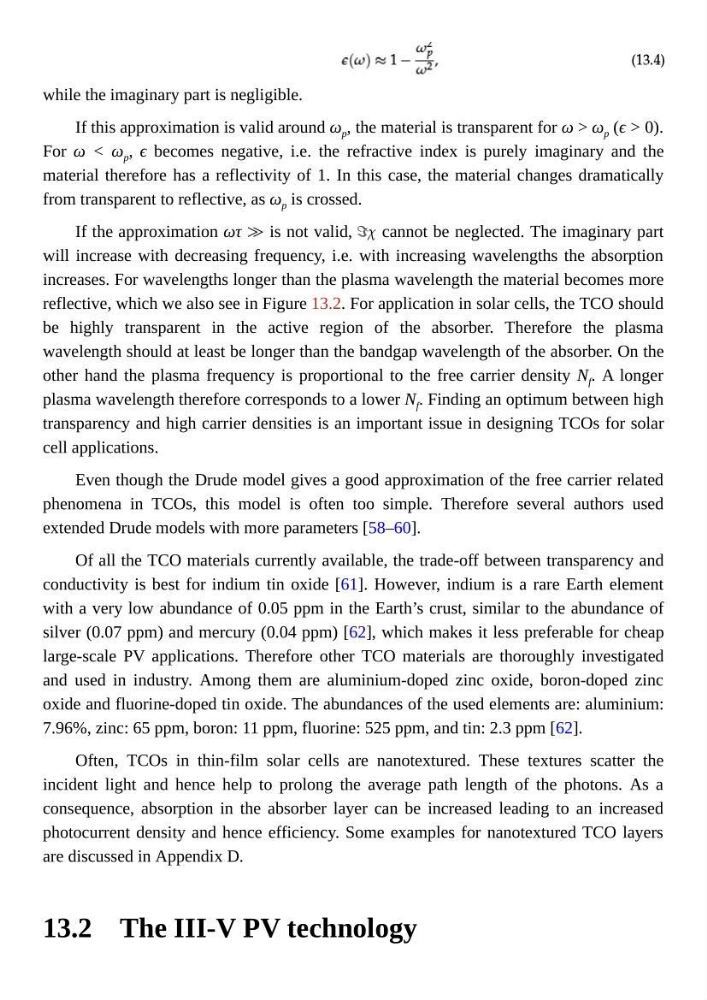
while the imaginary part is negligible.
If this approximation is valid around ω p , the material is transparent for ω > ω p (ϵ > 0).
For ω < ω p , ϵ becomes negative, i.e. the refractive index is purely imaginary and the
material therefore has a reflectivity of 1. In this case, the material changes dramatically
from transparent to reflective, as ω p is crossed.
If the approximation ωτ ≫ is not valid, cannot be neglected. The imaginary part
will increase with decreasing frequency, i.e. with increasing wavelengths the absorption
increases. For wavelengths longer than the plasma wavelength the material becomes more
reflective, which we also see in Figure 13.2. For application in solar cells, the TCO should
be highly transparent in the active region of the absorber. Therefore the plasma
wavelength should at least be longer than the bandgap wavelength of the absorber. On the
other hand the plasma frequency is proportional to the free carrier density N f . A longer
plasma wavelength therefore corresponds to a lower N f . Finding an optimum between high
transparency and high carrier densities is an important issue in designing TCOs for solar
cell applications.
Even though the Drude model gives a good approximation of the free carrier related
phenomena in TCOs, this model is often too simple. Therefore several authors used
extended Drude models with more parameters [58–60].
Of all the TCO materials currently available, the trade-off between transparency and
conductivity is best for indium tin oxide [61]. However, indium is a rare Earth element
with a very low abundance of 0.05 ppm in the Earth’s crust, similar to the abundance of
silver (0.07 ppm) and mercury (0.04 ppm) [62], which makes it less preferable for cheap
large-scale PV applications. Therefore other TCO materials are thoroughly investigated
and used in industry. Among them are aluminium-doped zinc oxide, boron-doped zinc
oxide and fluorine-doped tin oxide. The abundances of the used elements are: aluminium:
7.96%, zinc: 65 ppm, boron: 11 ppm, fluorine: 525 ppm, and tin: 2.3 ppm [62].
Often, TCOs in thin-film solar cells are nanotextured. These textures scatter the
incident light and hence help to prolong the average path length of the photons. As a
consequence, absorption in the absorber layer can be increased leading to an increased
photocurrent density and hence efficiency. Some examples for nanotextured TCO layers
are discussed in Appendix D.
The III-V PV technology
while the imaginary part is negligible.
If this approximation is valid around ω p , the material is transparent for ω > ω p (ϵ > 0).
For ω < ω p , ϵ becomes negative, i.e. the refractive index is purely imaginary and the
material therefore has a reflectivity of 1. In this case, the material changes dramatically
from transparent to reflective, as ω p is crossed.
If the approximation ωτ ≫ is not valid, cannot be neglected. The imaginary part
will increase with decreasing frequency, i.e. with increasing wavelengths the absorption
increases. For wavelengths longer than the plasma wavelength the material becomes more
reflective, which we also see in Figure 13.2. For application in solar cells, the TCO should
be highly transparent in the active region of the absorber. Therefore the plasma
wavelength should at least be longer than the bandgap wavelength of the absorber. On the
other hand the plasma frequency is proportional to the free carrier density N f . A longer
plasma wavelength therefore corresponds to a lower N f . Finding an optimum between high
transparency and high carrier densities is an important issue in designing TCOs for solar
cell applications.
Even though the Drude model gives a good approximation of the free carrier related
phenomena in TCOs, this model is often too simple. Therefore several authors used
extended Drude models with more parameters [58–60].
Of all the TCO materials currently available, the trade-off between transparency and
conductivity is best for indium tin oxide [61]. However, indium is a rare Earth element
with a very low abundance of 0.05 ppm in the Earth’s crust, similar to the abundance of
silver (0.07 ppm) and mercury (0.04 ppm) [62], which makes it less preferable for cheap
large-scale PV applications. Therefore other TCO materials are thoroughly investigated
and used in industry. Among them are aluminium-doped zinc oxide, boron-doped zinc
oxide and fluorine-doped tin oxide. The abundances of the used elements are: aluminium:
7.96%, zinc: 65 ppm, boron: 11 ppm, fluorine: 525 ppm, and tin: 2.3 ppm [62].
Often, TCOs in thin-film solar cells are nanotextured. These textures scatter the
incident light and hence help to prolong the average path length of the photons. As a
consequence, absorption in the absorber layer can be increased leading to an increased
photocurrent density and hence efficiency. Some examples for nanotextured TCO layers
are discussed in Appendix D.
The III-V PV technology