

Current Problems in Computer Simulation of Variability …
243
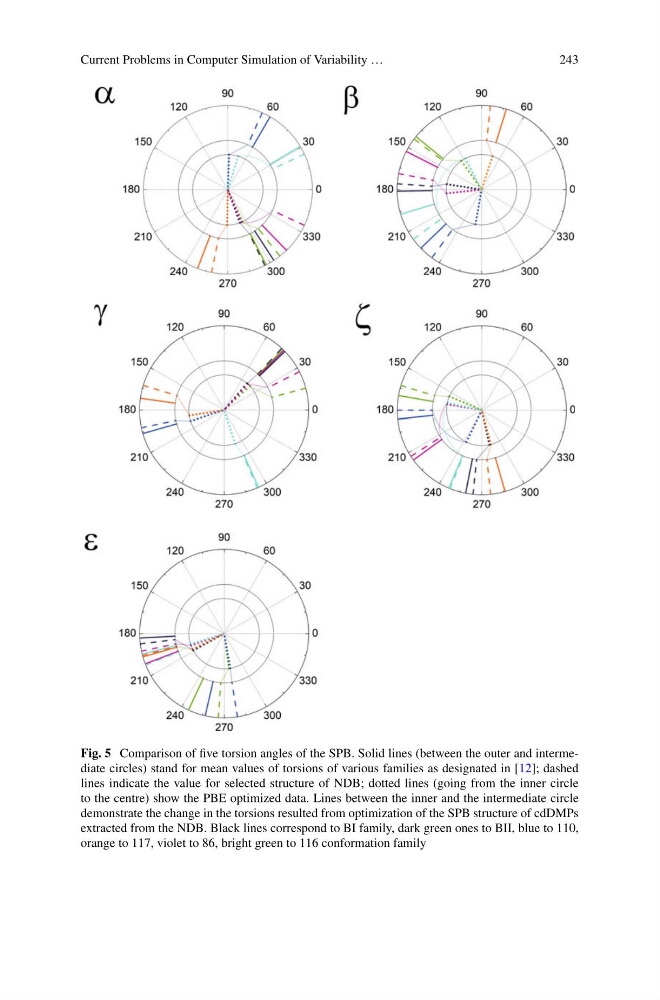
Fig. 5 Comparison of five torsion angles of the SPB. Solid lines (between the outer and intermediate circles) stand for mean values of torsions of various families as designated in [12]; dashed
lines indicate the value for selected structure of NDB; dotted lines (going from the inner circle
to the centre) show the PBE optimized data. Lines between the inner and the intermediate circle
demonstrate the change in the torsions resulted from optimization of the SPB structure of cdDMPs
extracted from the NDB. Black lines correspond to BI family, dark green ones to BII, blue to 110,
orange to 117, violet to 86, bright green to 116 conformation family
243
Fig. 5 Comparison of five torsion angles of the SPB. Solid lines (between the outer and intermediate circles) stand for mean values of torsions of various families as designated in [12]; dashed
lines indicate the value for selected structure of NDB; dotted lines (going from the inner circle
to the centre) show the PBE optimized data. Lines between the inner and the intermediate circle
demonstrate the change in the torsions resulted from optimization of the SPB structure of cdDMPs
extracted from the NDB. Black lines correspond to BI family, dark green ones to BII, blue to 110,
orange to 117, violet to 86, bright green to 116 conformation family