

2.2 Data analysis method
Data analysis was carried out in a qualitative way (Creswell 2002). After the field observation
process is complete, the results of the literature and field documentation are directly compared
and analyzed by means of data coding and text data analysis (Kumar 2005) for further descriptive
interpretations based on predetermined variables. To enrich the results of the analysis, the authors
also collect secondary data in the form of theory and earlier research as well as the results of personal
documentation from residents of Jalan Jaksa as well as documents from internet reviews related to
special events (for example: Jalan Jaksa festival, Republic of Indonesia anniversary) which occurs
at the case study location and is considered the peak season time to enrich the description of the
interpretation results.
3 RESULT AND DISCUSSION
3.1 Result
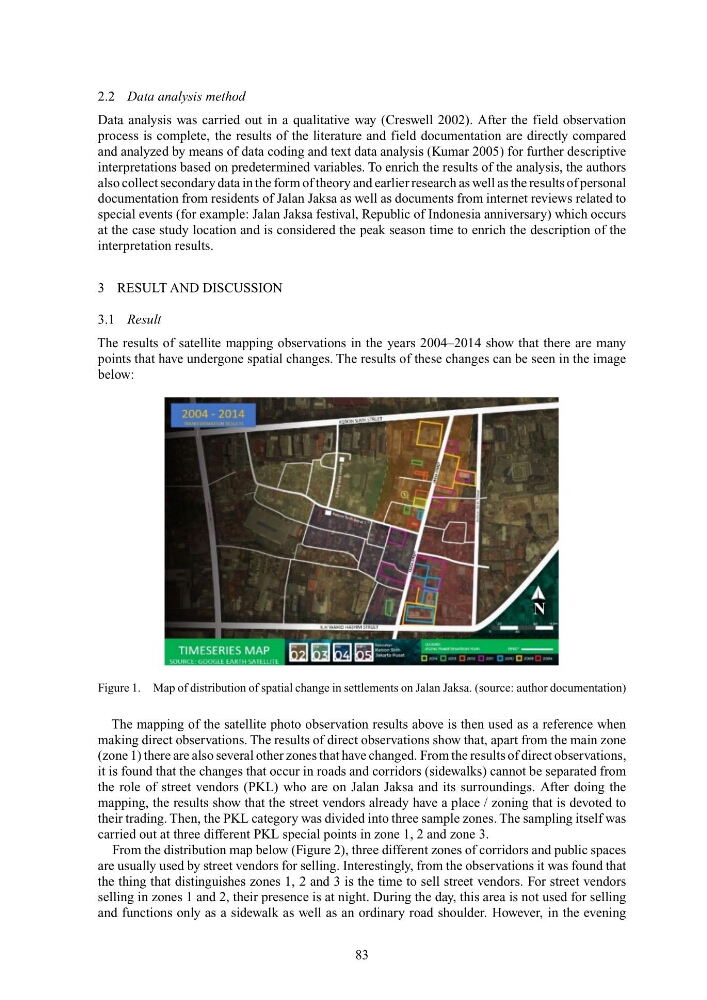
The results of satellite mapping observations in the years 2004–2014 show that there are many
points that have undergone spatial changes. The results of these changes can be seen in the image
below:
Figure 1. Map of distribution of spatial change in settlements on Jalan Jaksa. (source: author documentation)
The mapping of the satellite photo observation results above is then used as a reference when
making direct observations. The results of direct observations show that, apart from the main zone
(zone 1) there are also several other zones that have changed. From the results of direct observations,
it is found that the changes that occur in roads and corridors (sidewalks) cannot be separated from
the role of street vendors (PKL) who are on Jalan Jaksa and its surroundings. After doing the
mapping, the results show that the street vendors already have a place / zoning that is devoted to
their trading. Then, the PKL category was divided into three sample zones. The sampling itself was
carried out at three different PKL special points in zone 1, 2 and zone 3.
From the distribution map below (Figure 2), three different zones of corridors and public spaces
are usually used by street vendors for selling. Interestingly, from the observations it was found that
the thing that distinguishes zones 1, 2 and 3 is the time to sell street vendors. For street vendors
selling in zones 1 and 2, their presence is at night. During the day, this area is not used for selling
and functions only as a sidewalk as well as an ordinary road shoulder. However, in the evening
83
Data analysis was carried out in a qualitative way (Creswell 2002). After the field observation
process is complete, the results of the literature and field documentation are directly compared
and analyzed by means of data coding and text data analysis (Kumar 2005) for further descriptive
interpretations based on predetermined variables. To enrich the results of the analysis, the authors
also collect secondary data in the form of theory and earlier research as well as the results of personal
documentation from residents of Jalan Jaksa as well as documents from internet reviews related to
special events (for example: Jalan Jaksa festival, Republic of Indonesia anniversary) which occurs
at the case study location and is considered the peak season time to enrich the description of the
interpretation results.
3 RESULT AND DISCUSSION
3.1 Result
The results of satellite mapping observations in the years 2004–2014 show that there are many
points that have undergone spatial changes. The results of these changes can be seen in the image
below:
Figure 1. Map of distribution of spatial change in settlements on Jalan Jaksa. (source: author documentation)
The mapping of the satellite photo observation results above is then used as a reference when
making direct observations. The results of direct observations show that, apart from the main zone
(zone 1) there are also several other zones that have changed. From the results of direct observations,
it is found that the changes that occur in roads and corridors (sidewalks) cannot be separated from
the role of street vendors (PKL) who are on Jalan Jaksa and its surroundings. After doing the
mapping, the results show that the street vendors already have a place / zoning that is devoted to
their trading. Then, the PKL category was divided into three sample zones. The sampling itself was
carried out at three different PKL special points in zone 1, 2 and zone 3.
From the distribution map below (Figure 2), three different zones of corridors and public spaces
are usually used by street vendors for selling. Interestingly, from the observations it was found that
the thing that distinguishes zones 1, 2 and 3 is the time to sell street vendors. For street vendors
selling in zones 1 and 2, their presence is at night. During the day, this area is not used for selling
and functions only as a sidewalk as well as an ordinary road shoulder. However, in the evening
83