

1 3
Top Curr Chem (Z) (2018) 376:10
the broadband excitation spectrum spans over the entire absorption spectrum of chlorophyll a.
The monomeric chlorophyll a was probed in different solvents where an inhomogeneous broadening is always observed (Fig. 5) [18]. The elongated 2D line shape
evolves towards a symmetric one in different time-scale depending on the solvent.
This clearly unravels a spectral diffusion attributed to solvation. The slowest spectral
diffusion was observed for H-bonding and/or viscous solvent. It was attributed to a
spectral diffusion. Understanding these phenomena is a key parameter to optimize
the biomimetic devices.
In Fig. 5a, there are two positive bands on the 2DES map of chlorophyll a in
acetone at 50 fs: one elongated along the diagonal and another one out of the diagonal. The first one is attributed to the photobleaching and stimulated emission of the
molecule and the second one to its stimulated emission from a vibronic energy level.
From T = 50 fs to T = 600 ps, the photobleaching band gets more symmetric. This is
clear evidence of a spectral diffusion. To quantify this inhomogeneity, the ellipticity
of the photobleaching band was measured and plotted in Fig. 5c. The ellipticity is
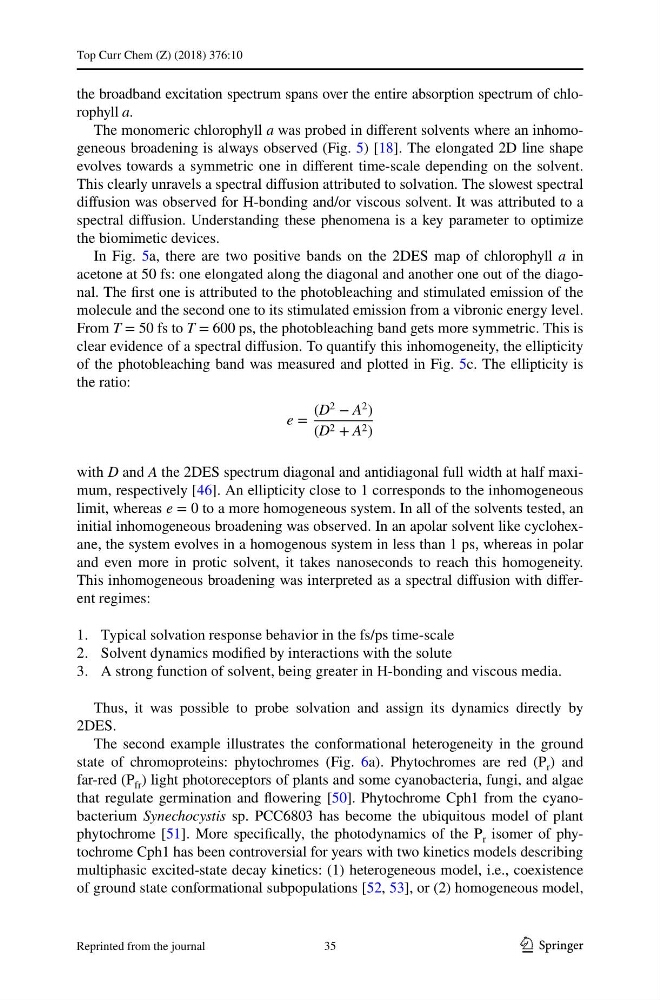
the ratio:
with D and A the 2DES spectrum diagonal and antidiagonal full width at half maximum, respectively [46]. An ellipticity close to 1 corresponds to the inhomogeneous
limit, whereas e = 0 to a more homogeneous system. In all of the solvents tested, an
initial inhomogeneous broadening was observed. In an apolar solvent like cyclohexane, the system evolves in a homogenous system in less than 1 ps, whereas in polar
and even more in protic solvent, it takes nanoseconds to reach this homogeneity.
This inhomogeneous broadening was interpreted as a spectral diffusion with different regimes:
1. Typical solvation response behavior in the fs/ps time-scale
2. Solvent dynamics modified by interactions with the solute
3. A strong function of solvent, being greater in H-bonding and viscous media.
Thus, it was possible to probe solvation and assign its dynamics directly by
2DES.
The second example illustrates the conformational heterogeneity in the ground
state of chromoproteins: phytochromes (Fig. 6a). Phytochromes are red (P r ) and
far-red (P fr ) light photoreceptors of plants and some cyanobacteria, fungi, and algae
that regulate germination and flowering [50]. Phytochrome Cph1 from the cyanobacterium Synechocystis sp. PCC6803 has become the ubiquitous model of plant
phytochrome [51]. More specifically, the photodynamics of the P r isomer of phytochrome Cph1 has been controversial for years with two kinetics models describing
multiphasic excited-state decay kinetics: (1) heterogeneous model, i.e., coexistence
of ground state conformational subpopulations [52, 53], or (2) homogeneous model,
e =
(D 2 − A
2 )
(D 2 + A 2 )
35
Reprinted from the journal
Top Curr Chem (Z) (2018) 376:10
the broadband excitation spectrum spans over the entire absorption spectrum of chlorophyll a.
The monomeric chlorophyll a was probed in different solvents where an inhomogeneous broadening is always observed (Fig. 5) [18]. The elongated 2D line shape
evolves towards a symmetric one in different time-scale depending on the solvent.
This clearly unravels a spectral diffusion attributed to solvation. The slowest spectral
diffusion was observed for H-bonding and/or viscous solvent. It was attributed to a
spectral diffusion. Understanding these phenomena is a key parameter to optimize
the biomimetic devices.
In Fig. 5a, there are two positive bands on the 2DES map of chlorophyll a in
acetone at 50 fs: one elongated along the diagonal and another one out of the diagonal. The first one is attributed to the photobleaching and stimulated emission of the
molecule and the second one to its stimulated emission from a vibronic energy level.
From T = 50 fs to T = 600 ps, the photobleaching band gets more symmetric. This is
clear evidence of a spectral diffusion. To quantify this inhomogeneity, the ellipticity
of the photobleaching band was measured and plotted in Fig. 5c. The ellipticity is
the ratio:
with D and A the 2DES spectrum diagonal and antidiagonal full width at half maximum, respectively [46]. An ellipticity close to 1 corresponds to the inhomogeneous
limit, whereas e = 0 to a more homogeneous system. In all of the solvents tested, an
initial inhomogeneous broadening was observed. In an apolar solvent like cyclohexane, the system evolves in a homogenous system in less than 1 ps, whereas in polar
and even more in protic solvent, it takes nanoseconds to reach this homogeneity.
This inhomogeneous broadening was interpreted as a spectral diffusion with different regimes:
1. Typical solvation response behavior in the fs/ps time-scale
2. Solvent dynamics modified by interactions with the solute
3. A strong function of solvent, being greater in H-bonding and viscous media.
Thus, it was possible to probe solvation and assign its dynamics directly by
2DES.
The second example illustrates the conformational heterogeneity in the ground
state of chromoproteins: phytochromes (Fig. 6a). Phytochromes are red (P r ) and
far-red (P fr ) light photoreceptors of plants and some cyanobacteria, fungi, and algae
that regulate germination and flowering [50]. Phytochrome Cph1 from the cyanobacterium Synechocystis sp. PCC6803 has become the ubiquitous model of plant
phytochrome [51]. More specifically, the photodynamics of the P r isomer of phytochrome Cph1 has been controversial for years with two kinetics models describing
multiphasic excited-state decay kinetics: (1) heterogeneous model, i.e., coexistence
of ground state conformational subpopulations [52, 53], or (2) homogeneous model,
e =
(D 2 − A
2 )
(D 2 + A 2 )
35
Reprinted from the journal