

Top Curr Chem (Z) (2018) 376:10
1 3
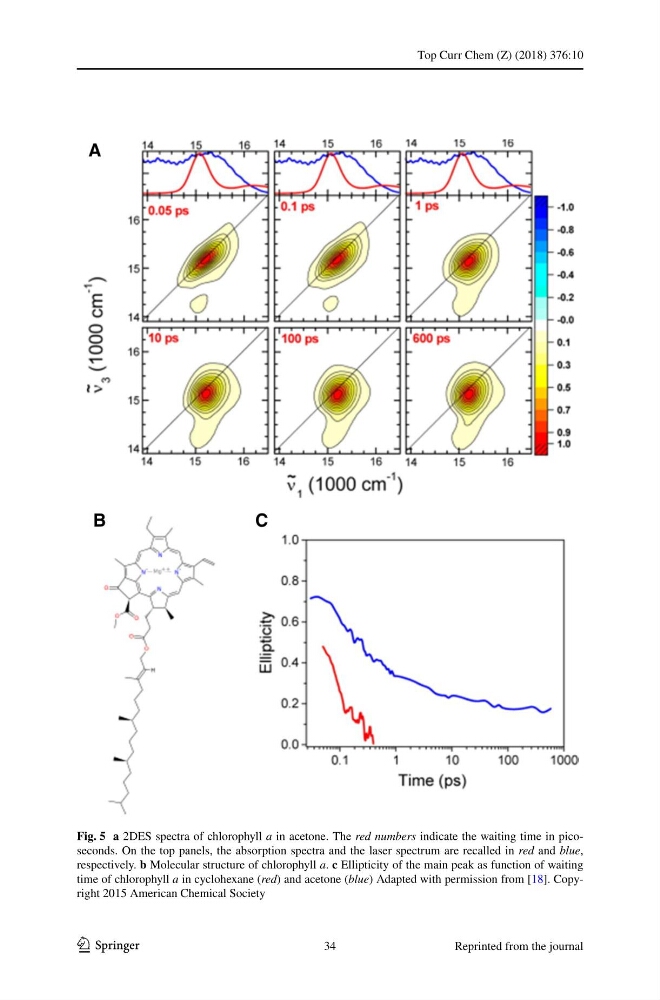
Fig. 5 a 2DES spectra of chlorophyll a in acetone. The red numbers indicate the waiting time in picoseconds. On the top panels, the absorption spectra and the laser spectrum are recalled in red and blue,
respectively. b Molecular structure of chlorophyll a. c Ellipticity of the main peak as function of waiting
time of chlorophyll a in cyclohexane (red) and acetone (blue) Adapted with permission from [18]. Copyright 2015 American Chemical Society
34
Reprinted from the journal
1 3
Fig. 5 a 2DES spectra of chlorophyll a in acetone. The red numbers indicate the waiting time in picoseconds. On the top panels, the absorption spectra and the laser spectrum are recalled in red and blue,
respectively. b Molecular structure of chlorophyll a. c Ellipticity of the main peak as function of waiting
time of chlorophyll a in cyclohexane (red) and acetone (blue) Adapted with permission from [18]. Copyright 2015 American Chemical Society
34
Reprinted from the journal