

1 3
Top Curr Chem (Z) (2018) 376:10
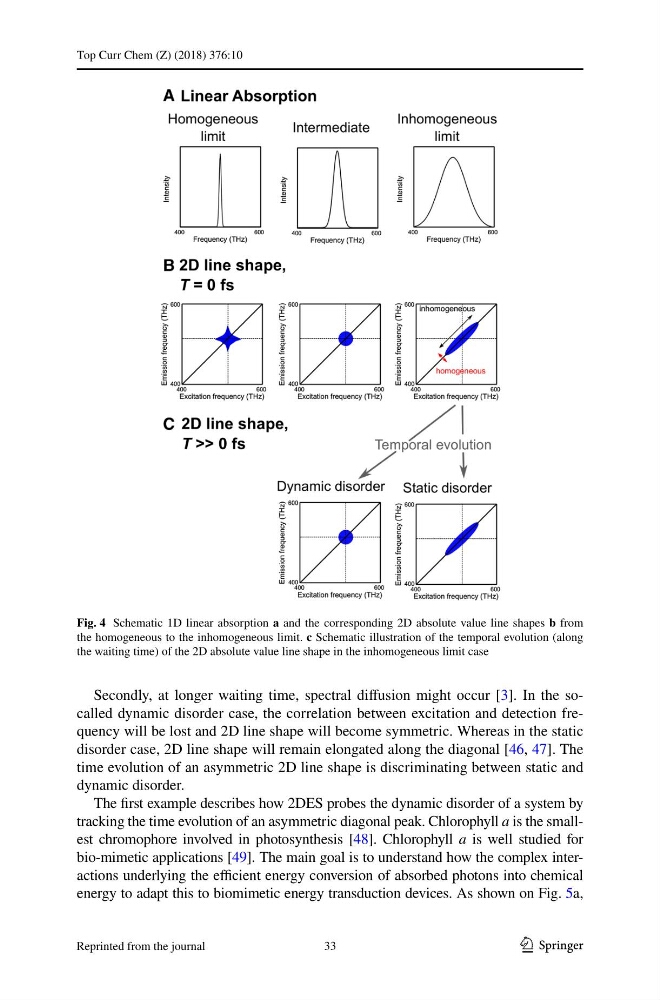
Secondly, at longer waiting time, spectral diffusion might occur [3]. In the socalled dynamic disorder case, the correlation between excitation and detection frequency will be lost and 2D line shape will become symmetric. Whereas in the static
disorder case, 2D line shape will remain elongated along the diagonal [46, 47]. The
time evolution of an asymmetric 2D line shape is discriminating between static and
dynamic disorder.
The first example describes how 2DES probes the dynamic disorder of a system by
tracking the time evolution of an asymmetric diagonal peak. Chlorophyll a is the smallest chromophore involved in photosynthesis [48]. Chlorophyll a is well studied for
bio-mimetic applications [49]. The main goal is to understand how the complex interactions underlying the efficient energy conversion of absorbed photons into chemical
energy to adapt this to biomimetic energy transduction devices. As shown on Fig. 5a,
Fig. 4 Schematic 1D linear absorption a and the corresponding 2D absolute value line shapes b from
the homogeneous to the inhomogeneous limit. c Schematic illustration of the temporal evolution (along
the waiting time) of the 2D absolute value line shape in the inhomogeneous limit case
33
Reprinted from the journal
Top Curr Chem (Z) (2018) 376:10
Secondly, at longer waiting time, spectral diffusion might occur [3]. In the socalled dynamic disorder case, the correlation between excitation and detection frequency will be lost and 2D line shape will become symmetric. Whereas in the static
disorder case, 2D line shape will remain elongated along the diagonal [46, 47]. The
time evolution of an asymmetric 2D line shape is discriminating between static and
dynamic disorder.
The first example describes how 2DES probes the dynamic disorder of a system by
tracking the time evolution of an asymmetric diagonal peak. Chlorophyll a is the smallest chromophore involved in photosynthesis [48]. Chlorophyll a is well studied for
bio-mimetic applications [49]. The main goal is to understand how the complex interactions underlying the efficient energy conversion of absorbed photons into chemical
energy to adapt this to biomimetic energy transduction devices. As shown on Fig. 5a,
Fig. 4 Schematic 1D linear absorption a and the corresponding 2D absolute value line shapes b from
the homogeneous to the inhomogeneous limit. c Schematic illustration of the temporal evolution (along
the waiting time) of the 2D absolute value line shape in the inhomogeneous limit case
33
Reprinted from the journal