

1 3
Top Curr Chem (Z) (2018) 376:6
as shown in Fig. 29c. A third-order spectral peak is located at the fundamental AF
mode frequency f AF . The peak arises from a sum of the third-order signals resulting
from different excitation pathways as detailed below. Magnon SHG signal is located
at the second-harmonic AF mode frequency 2f AF .
The 2D B NL trace of the AF mode was recorded as a function of the inter-pulse
delay τ and detection time t by incrementing τ with a small step size and recording
the t-dependent signal B NL at each τ. Rotating the sample about the crystal a axis
allowed excitation of the F mode, and the 2D B NL trace of the F mode was recorded
in the same manner. The 2D numerical Fourier transformation of the B NL (t, τ) traces
with respect to t and τ generated the 2D complex spectrum of each magnon mode.
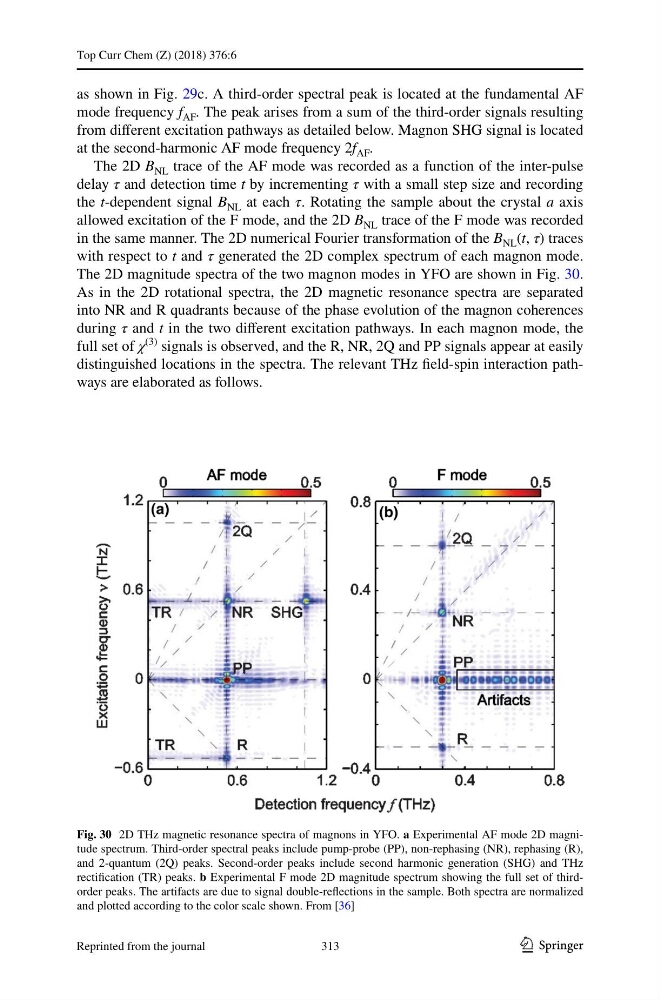
The 2D magnitude spectra of the two magnon modes in YFO are shown in Fig. 30.
As in the 2D rotational spectra, the 2D magnetic resonance spectra are separated
into NR and R quadrants because of the phase evolution of the magnon coherences
during τ and t in the two different excitation pathways. In each magnon mode, the
full set of χ
(3)
signals is observed, and the R, NR, 2Q and PP signals appear at easily
distinguished locations in the spectra. The relevant THz field-spin interaction pathways are elaborated as follows.
Fig. 30 2D THz magnetic resonance spectra of magnons in YFO. a Experimental AF mode 2D magnitude spectrum. Third-order spectral peaks include pump-probe (PP), non-rephasing (NR), rephasing (R),
and 2-quantum (2Q) peaks. Second-order peaks include second harmonic generation (SHG) and THz
rectification (TR) peaks. b Experimental F mode 2D magnitude spectrum showing the full set of thirdorder peaks. The artifacts are due to signal double-reflections in the sample. Both spectra are normalized
and plotted according to the color scale shown. From [36]
313
Reprinted from the journal
Top Curr Chem (Z) (2018) 376:6
as shown in Fig. 29c. A third-order spectral peak is located at the fundamental AF
mode frequency f AF . The peak arises from a sum of the third-order signals resulting
from different excitation pathways as detailed below. Magnon SHG signal is located
at the second-harmonic AF mode frequency 2f AF .
The 2D B NL trace of the AF mode was recorded as a function of the inter-pulse
delay τ and detection time t by incrementing τ with a small step size and recording
the t-dependent signal B NL at each τ. Rotating the sample about the crystal a axis
allowed excitation of the F mode, and the 2D B NL trace of the F mode was recorded
in the same manner. The 2D numerical Fourier transformation of the B NL (t, τ) traces
with respect to t and τ generated the 2D complex spectrum of each magnon mode.
The 2D magnitude spectra of the two magnon modes in YFO are shown in Fig. 30.
As in the 2D rotational spectra, the 2D magnetic resonance spectra are separated
into NR and R quadrants because of the phase evolution of the magnon coherences
during τ and t in the two different excitation pathways. In each magnon mode, the
full set of χ
(3)
signals is observed, and the R, NR, 2Q and PP signals appear at easily
distinguished locations in the spectra. The relevant THz field-spin interaction pathways are elaborated as follows.
Fig. 30 2D THz magnetic resonance spectra of magnons in YFO. a Experimental AF mode 2D magnitude spectrum. Third-order spectral peaks include pump-probe (PP), non-rephasing (NR), rephasing (R),
and 2-quantum (2Q) peaks. Second-order peaks include second harmonic generation (SHG) and THz
rectification (TR) peaks. b Experimental F mode 2D magnitude spectrum showing the full set of thirdorder peaks. The artifacts are due to signal double-reflections in the sample. Both spectra are normalized
and plotted according to the color scale shown. From [36]
313
Reprinted from the journal