

Top Curr Chem (Z) (2018) 376:6
1 3
signal fields are measured by EOS, and each magnon mode is resolved in the spectrum from Fourier transformation of the FID signals, as shown in Fig. 28b, c.
The experimental setup used is identical to that shown in Fig. 6. The sample is an
a-cut single crystal of YFO. In response to time-delayed strong THz pulse pair excitation, nonlinear magnon responses are readily revealed in the time-domain signal of
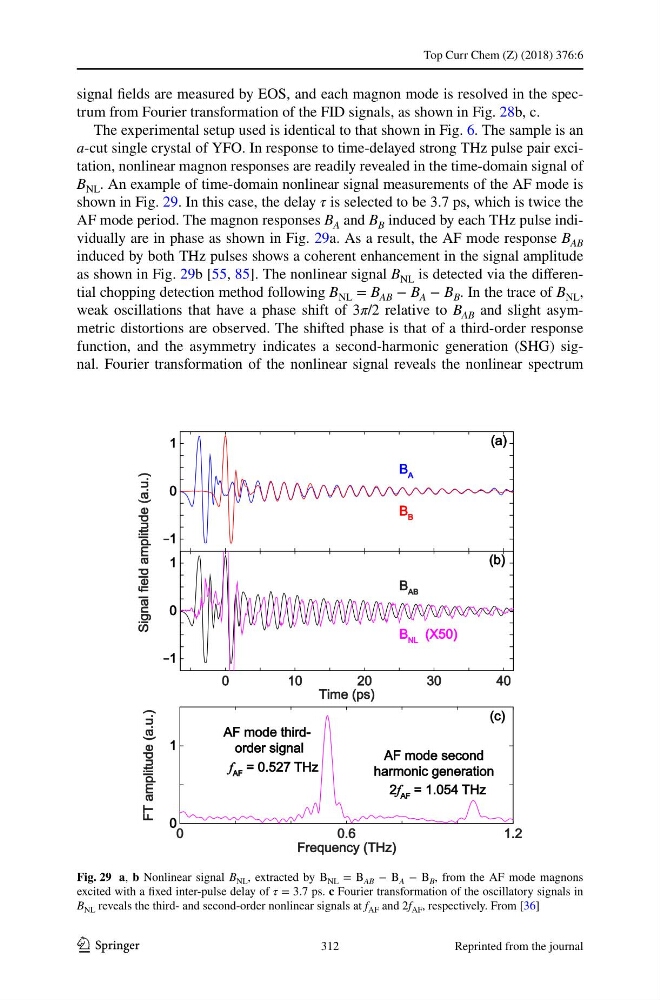
B NL . An example of time-domain nonlinear signal measurements of the AF mode is
shown in Fig. 29. In this case, the delay τ is selected to be 3.7 ps, which is twice the
AF mode period. The magnon responses B A and B B induced by each THz pulse individually are in phase as shown in Fig. 29a. As a result, the AF mode response B AB
induced by both THz pulses shows a coherent enhancement in the signal amplitude
as shown in Fig. 29b [55, 85]. The nonlinear signal B NL is detected via the differential chopping detection method following B NL = B AB − B A − B B . In the trace of B NL ,
weak oscillations that have a phase shift of 3π/2 relative to B AB and slight asymmetric distortions are observed. The shifted phase is that of a third-order response
function, and the asymmetry indicates a second-harmonic generation (SHG) signal. Fourier transformation of the nonlinear signal reveals the nonlinear spectrum
Fig. 29 a, b Nonlinear signal B NL , extracted by B NL = B AB − B A − B B , from the AF mode magnons
excited with a fixed inter-pulse delay of τ = 3.7 ps. c Fourier transformation of the oscillatory signals in
B NL reveals the third- and second-order nonlinear signals at f AF and 2f AF , respectively. From [36]
312
Reprinted from the journal
1 3
signal fields are measured by EOS, and each magnon mode is resolved in the spectrum from Fourier transformation of the FID signals, as shown in Fig. 28b, c.
The experimental setup used is identical to that shown in Fig. 6. The sample is an
a-cut single crystal of YFO. In response to time-delayed strong THz pulse pair excitation, nonlinear magnon responses are readily revealed in the time-domain signal of
B NL . An example of time-domain nonlinear signal measurements of the AF mode is
shown in Fig. 29. In this case, the delay τ is selected to be 3.7 ps, which is twice the
AF mode period. The magnon responses B A and B B induced by each THz pulse individually are in phase as shown in Fig. 29a. As a result, the AF mode response B AB
induced by both THz pulses shows a coherent enhancement in the signal amplitude
as shown in Fig. 29b [55, 85]. The nonlinear signal B NL is detected via the differential chopping detection method following B NL = B AB − B A − B B . In the trace of B NL ,
weak oscillations that have a phase shift of 3π/2 relative to B AB and slight asymmetric distortions are observed. The shifted phase is that of a third-order response
function, and the asymmetry indicates a second-harmonic generation (SHG) signal. Fourier transformation of the nonlinear signal reveals the nonlinear spectrum
Fig. 29 a, b Nonlinear signal B NL , extracted by B NL = B AB − B A − B B , from the AF mode magnons
excited with a fixed inter-pulse delay of τ = 3.7 ps. c Fourier transformation of the oscillatory signals in
B NL reveals the third- and second-order nonlinear signals at f AF and 2f AF , respectively. From [36]
312
Reprinted from the journal