

1 3
Top Curr Chem (Z) (2018) 376:6
the time scale of a stable network pattern and thus provide mechanistic insights into
the microscopic structure of the hydrogen bond in neat water and aqueous solutions
[39].
The first 2D Raman-THz spectroscopy experiments have been realized in water
and aqueous solutions recently [38], yielding 2D time-domain signals including
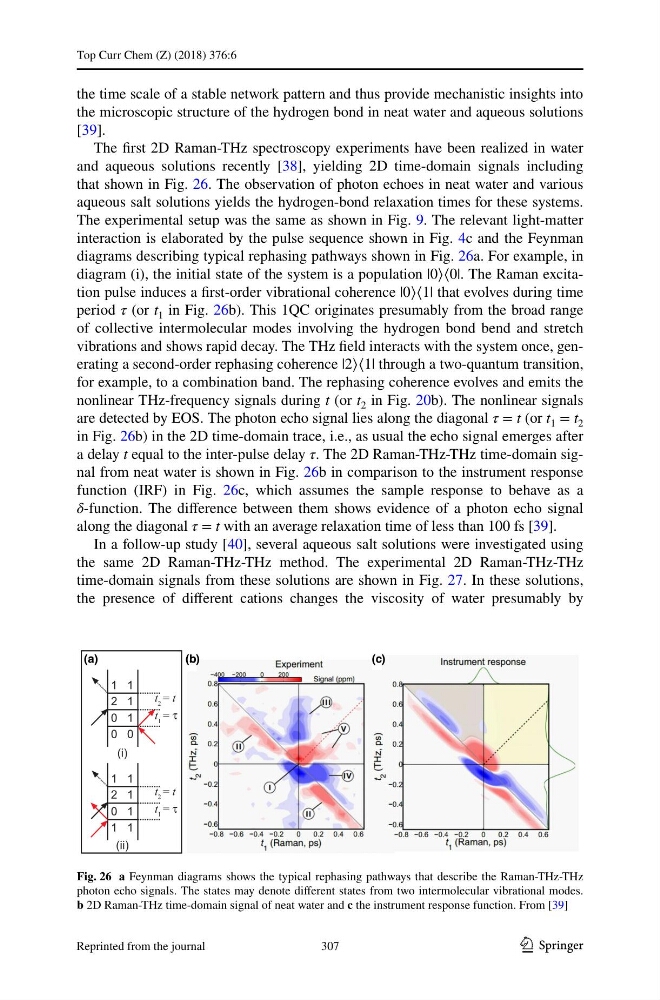
that shown in Fig. 26. The observation of photon echoes in neat water and various
aqueous salt solutions yields the hydrogen-bond relaxation times for these systems.
The experimental setup was the same as shown in Fig. 9. The relevant light-matter
interaction is elaborated by the pulse sequence shown in Fig. 4c and the Feynman
diagrams describing typical rephasing pathways shown in Fig. 26a. For example, in
diagram (i), the initial state of the system is a population |0〉〈0|. The Raman excitation pulse induces a first-order vibrational coherence |0〉〈1| that evolves during time
period τ (or t 1 in Fig. 26b). This 1QC originates presumably from the broad range
of collective intermolecular modes involving the hydrogen bond bend and stretch
vibrations and shows rapid decay. The THz field interacts with the system once, generating a second-order rephasing coherence |2〉〈1| through a two-quantum transition,
for example, to a combination band. The rephasing coherence evolves and emits the
nonlinear THz-frequency signals during t (or t 2 in Fig. 20b). The nonlinear signals
are detected by EOS. The photon echo signal lies along the diagonal τ = t (or t 1 = t 2
in Fig. 26b) in the 2D time-domain trace, i.e., as usual the echo signal emerges after
a delay t equal to the inter-pulse delay τ. The 2D Raman-THz-THz time-domain signal from neat water is shown in Fig. 26b in comparison to the instrument response
function (IRF) in Fig. 26c, which assumes the sample response to behave as a
δ-function. The difference between them shows evidence of a photon echo signal
along the diagonal τ = t with an average relaxation time of less than 100 fs [39].
In a follow-up study [40], several aqueous salt solutions were investigated using
the same 2D Raman-THz-THz method. The experimental 2D Raman-THz-THz
time-domain signals from these solutions are shown in Fig. 27. In these solutions,
the presence of different cations changes the viscosity of water presumably by
)
c
(
)
b
(
0 0
0 1
1 1
2 1
(ii)
t 1 = τ
t 2 = t
1 1
0 1
1 1
2 1
(i)
t 1 = τ
t 2 = t
(a)
Fig. 26 a Feynman diagrams shows the typical rephasing pathways that describe the Raman-THz-THz
photon echo signals. The states may denote different states from two intermolecular vibrational modes.
b 2D Raman-THz time-domain signal of neat water and c the instrument response function. From [39]
307
Reprinted from the journal
Top Curr Chem (Z) (2018) 376:6
the time scale of a stable network pattern and thus provide mechanistic insights into
the microscopic structure of the hydrogen bond in neat water and aqueous solutions
[39].
The first 2D Raman-THz spectroscopy experiments have been realized in water
and aqueous solutions recently [38], yielding 2D time-domain signals including
that shown in Fig. 26. The observation of photon echoes in neat water and various
aqueous salt solutions yields the hydrogen-bond relaxation times for these systems.
The experimental setup was the same as shown in Fig. 9. The relevant light-matter
interaction is elaborated by the pulse sequence shown in Fig. 4c and the Feynman
diagrams describing typical rephasing pathways shown in Fig. 26a. For example, in
diagram (i), the initial state of the system is a population |0〉〈0|. The Raman excitation pulse induces a first-order vibrational coherence |0〉〈1| that evolves during time
period τ (or t 1 in Fig. 26b). This 1QC originates presumably from the broad range
of collective intermolecular modes involving the hydrogen bond bend and stretch
vibrations and shows rapid decay. The THz field interacts with the system once, generating a second-order rephasing coherence |2〉〈1| through a two-quantum transition,
for example, to a combination band. The rephasing coherence evolves and emits the
nonlinear THz-frequency signals during t (or t 2 in Fig. 20b). The nonlinear signals
are detected by EOS. The photon echo signal lies along the diagonal τ = t (or t 1 = t 2
in Fig. 26b) in the 2D time-domain trace, i.e., as usual the echo signal emerges after
a delay t equal to the inter-pulse delay τ. The 2D Raman-THz-THz time-domain signal from neat water is shown in Fig. 26b in comparison to the instrument response
function (IRF) in Fig. 26c, which assumes the sample response to behave as a
δ-function. The difference between them shows evidence of a photon echo signal
along the diagonal τ = t with an average relaxation time of less than 100 fs [39].
In a follow-up study [40], several aqueous salt solutions were investigated using
the same 2D Raman-THz-THz method. The experimental 2D Raman-THz-THz
time-domain signals from these solutions are shown in Fig. 27. In these solutions,
the presence of different cations changes the viscosity of water presumably by
)
c
(
)
b
(
0 0
0 1
1 1
2 1
(ii)
t 1 = τ
t 2 = t
1 1
0 1
1 1
2 1
(i)
t 1 = τ
t 2 = t
(a)
Fig. 26 a Feynman diagrams shows the typical rephasing pathways that describe the Raman-THz-THz
photon echo signals. The states may denote different states from two intermolecular vibrational modes.
b 2D Raman-THz time-domain signal of neat water and c the instrument response function. From [39]
307
Reprinted from the journal