

Top Curr Chem (Z) (2018) 376:6
1 3
Diagonal peaks that involve vibrational population pathways were not observed
in this experiment because of the orthogonal polarizations of the input THz pulse
pair and the limited THz bandwidth. Moreover, rephasing signals were not observed
because of the limited THz bandwidth. As shown by the example R pathway in diagram (iii) of Fig. 23, it requires THz excitation of the transition from |0〉 to |2〉, the
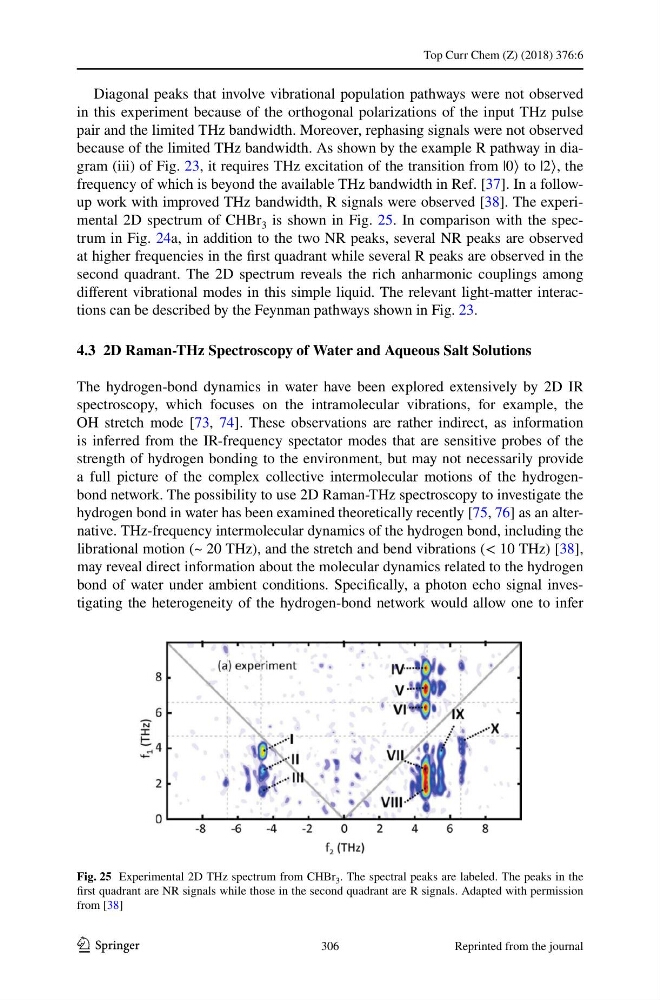
frequency of which is beyond the available THz bandwidth in Ref. [37]. In a followup work with improved THz bandwidth, R signals were observed [38]. The experimental 2D spectrum of CHBr 3 is shown in Fig. 25. In comparison with the spectrum in Fig. 24a, in addition to the two NR peaks, several NR peaks are observed
at higher frequencies in the first quadrant while several R peaks are observed in the
second quadrant. The 2D spectrum reveals the rich anharmonic couplings among
different vibrational modes in this simple liquid. The relevant light-matter interactions can be described by the Feynman pathways shown in Fig. 23.
4.3 2D Raman‑THz Spectroscopy of Water and Aqueous Salt Solutions
The hydrogen-bond dynamics in water have been explored extensively by 2D IR
spectroscopy, which focuses on the intramolecular vibrations, for example, the
OH stretch mode [73, 74]. These observations are rather indirect, as information
is inferred from the IR-frequency spectator modes that are sensitive probes of the
strength of hydrogen bonding to the environment, but may not necessarily provide
a full picture of the complex collective intermolecular motions of the hydrogenbond network. The possibility to use 2D Raman-THz spectroscopy to investigate the
hydrogen bond in water has been examined theoretically recently [75, 76] as an alternative. THz-frequency intermolecular dynamics of the hydrogen bond, including the
librational motion (~ 20 THz), and the stretch and bend vibrations (< 10 THz) [38],
may reveal direct information about the molecular dynamics related to the hydrogen
bond of water under ambient conditions. Specifically, a photon echo signal investigating the heterogeneity of the hydrogen-bond network would allow one to infer
Fig. 25 Experimental 2D THz spectrum from CHBr 3 . The spectral peaks are labeled. The peaks in the
first quadrant are NR signals while those in the second quadrant are R signals. Adapted with permission
from [38]
306
Reprinted from the journal
1 3
Diagonal peaks that involve vibrational population pathways were not observed
in this experiment because of the orthogonal polarizations of the input THz pulse
pair and the limited THz bandwidth. Moreover, rephasing signals were not observed
because of the limited THz bandwidth. As shown by the example R pathway in diagram (iii) of Fig. 23, it requires THz excitation of the transition from |0〉 to |2〉, the
frequency of which is beyond the available THz bandwidth in Ref. [37]. In a followup work with improved THz bandwidth, R signals were observed [38]. The experimental 2D spectrum of CHBr 3 is shown in Fig. 25. In comparison with the spectrum in Fig. 24a, in addition to the two NR peaks, several NR peaks are observed
at higher frequencies in the first quadrant while several R peaks are observed in the
second quadrant. The 2D spectrum reveals the rich anharmonic couplings among
different vibrational modes in this simple liquid. The relevant light-matter interactions can be described by the Feynman pathways shown in Fig. 23.
4.3 2D Raman‑THz Spectroscopy of Water and Aqueous Salt Solutions
The hydrogen-bond dynamics in water have been explored extensively by 2D IR
spectroscopy, which focuses on the intramolecular vibrations, for example, the
OH stretch mode [73, 74]. These observations are rather indirect, as information
is inferred from the IR-frequency spectator modes that are sensitive probes of the
strength of hydrogen bonding to the environment, but may not necessarily provide
a full picture of the complex collective intermolecular motions of the hydrogenbond network. The possibility to use 2D Raman-THz spectroscopy to investigate the
hydrogen bond in water has been examined theoretically recently [75, 76] as an alternative. THz-frequency intermolecular dynamics of the hydrogen bond, including the
librational motion (~ 20 THz), and the stretch and bend vibrations (< 10 THz) [38],
may reveal direct information about the molecular dynamics related to the hydrogen
bond of water under ambient conditions. Specifically, a photon echo signal investigating the heterogeneity of the hydrogen-bond network would allow one to infer
Fig. 25 Experimental 2D THz spectrum from CHBr 3 . The spectral peaks are labeled. The peaks in the
first quadrant are NR signals while those in the second quadrant are R signals. Adapted with permission
from [38]
306
Reprinted from the journal