

1 3
Top Curr Chem (Z) (2018) 376:6
where Π xy and μ xy are the polarizability and dipole transition moments and ρ eq is
the density matrix at equilibrium. The 1D signals shown in Fig. 22 essentially arise
from the same response function with τ set to zero. The 2D Fourier transformation
of the response function with respect to τ and t gives rise to an off-diagonal peak
located at (f, ν) = (ω ac , ω bc )/2π showing the coupling between the two vibrational
modes.
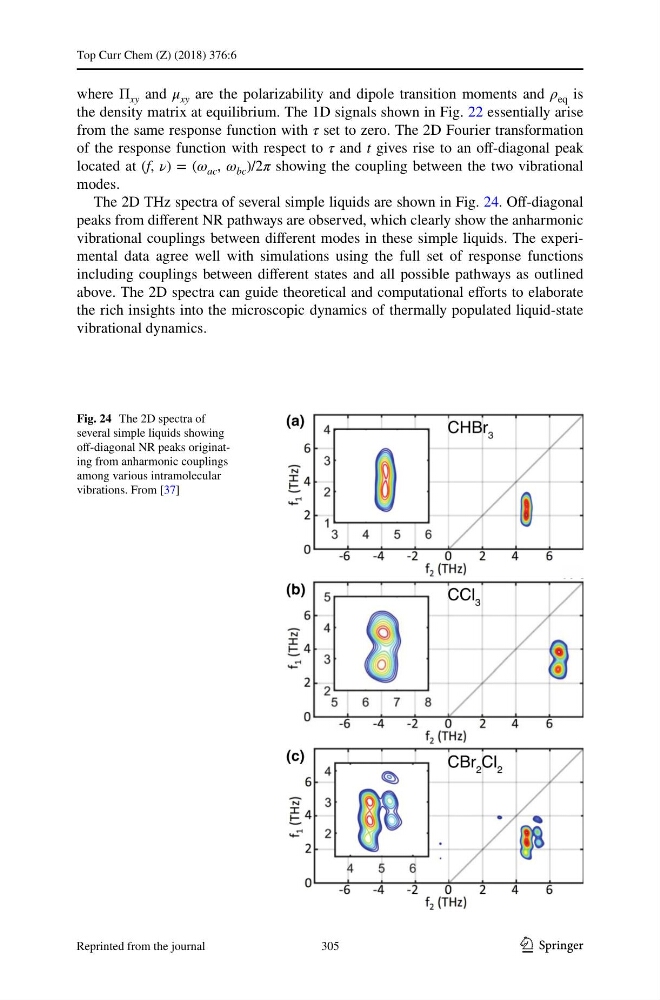
The 2D THz spectra of several simple liquids are shown in Fig. 24. Off-diagonal
peaks from different NR pathways are observed, which clearly show the anharmonic
vibrational couplings between different modes in these simple liquids. The experimental data agree well with simulations using the full set of response functions
including couplings between different states and all possible pathways as outlined
above. The 2D spectra can guide theoretical and computational efforts to elaborate
the rich insights into the microscopic dynamics of thermally populated liquid-state
vibrational dynamics.
Fig. 24 The 2D spectra of
several simple liquids showing
off-diagonal NR peaks originating from anharmonic couplings
among various intramolecular
vibrations. From [37]
305
Reprinted from the journal
Top Curr Chem (Z) (2018) 376:6
where Π xy and μ xy are the polarizability and dipole transition moments and ρ eq is
the density matrix at equilibrium. The 1D signals shown in Fig. 22 essentially arise
from the same response function with τ set to zero. The 2D Fourier transformation
of the response function with respect to τ and t gives rise to an off-diagonal peak
located at (f, ν) = (ω ac , ω bc )/2π showing the coupling between the two vibrational
modes.
The 2D THz spectra of several simple liquids are shown in Fig. 24. Off-diagonal
peaks from different NR pathways are observed, which clearly show the anharmonic
vibrational couplings between different modes in these simple liquids. The experimental data agree well with simulations using the full set of response functions
including couplings between different states and all possible pathways as outlined
above. The 2D spectra can guide theoretical and computational efforts to elaborate
the rich insights into the microscopic dynamics of thermally populated liquid-state
vibrational dynamics.
Fig. 24 The 2D spectra of
several simple liquids showing
off-diagonal NR peaks originating from anharmonic couplings
among various intramolecular
vibrations. From [37]
305
Reprinted from the journal