

Top Curr Chem (Z) (2018) 376:6
1 3
an isotropic distribution. On top of the orientational signal, oscillatory signals corresponding to Raman-active vibrational modes are observed. These Raman-active
modes are excited via two THz interactions, and the excitation pathways are revealed
in 2D THz-THz-Raman spectroscopy as discussed below.
In the 2D THz-THz-Raman spectroscopy experiment, differential chopping detection ensures that the nonlinear signal S NL results from one interaction with each THz
pulse, as the signals resulting from two interactions with either individual THz pulse
are excluded. An example of the THz field-matter interaction pathways is illustrated
following the THz-THz-Raman pulse sequence shown in Fig. 4b. Let us consider a
three-level system consisting of three states |a〉, |b〉, and |c〉, which denote the combination bands |1, 0〉, |0, 1〉, and |2, 0〉 of two vibrational modes. The transitions
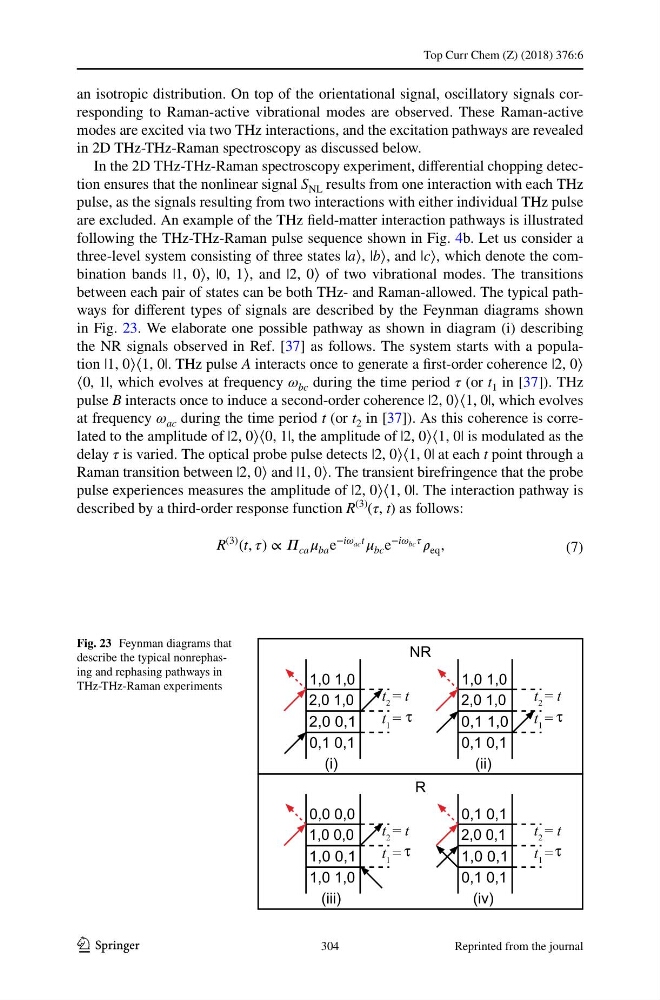
between each pair of states can be both THz- and Raman-allowed. The typical pathways for different types of signals are described by the Feynman diagrams shown
in Fig. 23. We elaborate one possible pathway as shown in diagram (i) describing
the NR signals observed in Ref. [37] as follows. The system starts with a population |1, 0〉〈1, 0|. THz pulse A interacts once to generate a first-order coherence |2, 0〉
〈0, 1|, which evolves at frequency ω bc during the time period τ (or t 1 in [37]). THz
pulse B interacts once to induce a second-order coherence |2, 0〉〈1, 0|, which evolves
at frequency ω ac during the time period t (or t 2 in [37]). As this coherence is correlated to the amplitude of |2, 0〉〈0, 1|, the amplitude of |2, 0〉〈1, 0| is modulated as the
delay τ is varied. The optical probe pulse detects |2, 0〉〈1, 0| at each t point through a
Raman transition between |2, 0〉 and |1, 0〉. The transient birefringence that the probe
pulse experiences measures the amplitude of |2, 0〉〈1, 0|. The interaction pathway is
described by a third-order response function R
(3)
(τ, t) as follows:
(7)
R
(3) (t, ) ∝ ca ba e
−i ac t bc e
−i bc eq ,
Fig. 23 Feynman diagrams that
describe the typical nonrephasing and rephasing pathways in
THz-THz-Raman experiments
τ
τ
τ
τ
304
Reprinted from the journal
1 3
an isotropic distribution. On top of the orientational signal, oscillatory signals corresponding to Raman-active vibrational modes are observed. These Raman-active
modes are excited via two THz interactions, and the excitation pathways are revealed
in 2D THz-THz-Raman spectroscopy as discussed below.
In the 2D THz-THz-Raman spectroscopy experiment, differential chopping detection ensures that the nonlinear signal S NL results from one interaction with each THz
pulse, as the signals resulting from two interactions with either individual THz pulse
are excluded. An example of the THz field-matter interaction pathways is illustrated
following the THz-THz-Raman pulse sequence shown in Fig. 4b. Let us consider a
three-level system consisting of three states |a〉, |b〉, and |c〉, which denote the combination bands |1, 0〉, |0, 1〉, and |2, 0〉 of two vibrational modes. The transitions
between each pair of states can be both THz- and Raman-allowed. The typical pathways for different types of signals are described by the Feynman diagrams shown
in Fig. 23. We elaborate one possible pathway as shown in diagram (i) describing
the NR signals observed in Ref. [37] as follows. The system starts with a population |1, 0〉〈1, 0|. THz pulse A interacts once to generate a first-order coherence |2, 0〉
〈0, 1|, which evolves at frequency ω bc during the time period τ (or t 1 in [37]). THz
pulse B interacts once to induce a second-order coherence |2, 0〉〈1, 0|, which evolves
at frequency ω ac during the time period t (or t 2 in [37]). As this coherence is correlated to the amplitude of |2, 0〉〈0, 1|, the amplitude of |2, 0〉〈1, 0| is modulated as the
delay τ is varied. The optical probe pulse detects |2, 0〉〈1, 0| at each t point through a
Raman transition between |2, 0〉 and |1, 0〉. The transient birefringence that the probe
pulse experiences measures the amplitude of |2, 0〉〈1, 0|. The interaction pathway is
described by a third-order response function R
(3)
(τ, t) as follows:
(7)
R
(3) (t, ) ∝ ca ba e
−i ac t bc e
−i bc eq ,
Fig. 23 Feynman diagrams that
describe the typical nonrephasing and rephasing pathways in
THz-THz-Raman experiments
τ
τ
τ
τ
304
Reprinted from the journal