

Top Curr Chem (Z) (2018) 376:6
1 3
oscillations at the 1QC frequencies along the two time variables, and in this example
the frequencies are the same, such that Fourier transformation of the signal with
respect to both time variables yields J-state-resolved diagonal peaks at frequencies
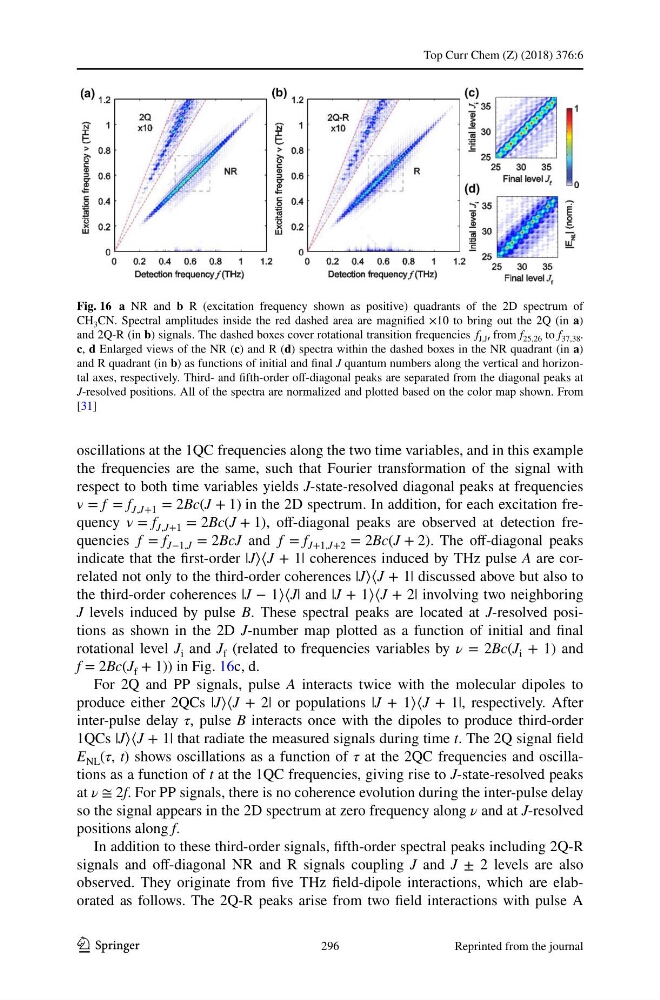
= f = f J,J+1 = 2Bc(J + 1) in the 2D spectrum. In addition, for each excitation frequency = f J,J+1 = 2Bc(J + 1) , off-diagonal peaks are observed at detection frequencies f = f J−1,J = 2BcJ and f = f J+1,J+2 = 2Bc(J + 2) . The off-diagonal peaks
indicate that the first-order |J〉〈J + 1| coherences induced by THz pulse A are correlated not only to the third-order coherences |J〉〈J + 1| discussed above but also to
the third-order coherences |J − 1〉〈J| and |J + 1〉〈J + 2| involving two neighboring
J levels induced by pulse B. These spectral peaks are located at J-resolved positions as shown in the 2D J-number map plotted as a function of initial and final
rotational level J i and J f (related to frequencies variables by ν = 2Bc(J i + 1) and
f = 2Bc(J f + 1)) in Fig. 16c, d.
For 2Q and PP signals, pulse A interacts twice with the molecular dipoles to
produce either 2QCs |J〉〈J + 2| or populations |J + 1〉〈J + 1|, respectively. After
inter-pulse delay τ, pulse B interacts once with the dipoles to produce third-order
1QCs |J〉〈J + 1| that radiate the measured signals during time t. The 2Q signal field
E NL (τ, t) shows oscillations as a function of τ at the 2QC frequencies and oscillations as a function of t at the 1QC frequencies, giving rise to J-state-resolved peaks
at ν ≅ 2f. For PP signals, there is no coherence evolution during the inter-pulse delay
so the signal appears in the 2D spectrum at zero frequency along ν and at J-resolved
positions along f.
In addition to these third-order signals, fifth-order spectral peaks including 2Q-R
signals and off-diagonal NR and R signals coupling J and J ± 2 levels are also
observed. They originate from five THz field-dipole interactions, which are elaborated as follows. The 2Q-R peaks arise from two field interactions with pulse A
Fig. 16 a NR and b R (excitation frequency shown as positive) quadrants of the 2D spectrum of
CH 3 CN. Spectral amplitudes inside the red dashed area are magnified ×10 to bring out the 2Q (in a)
and 2Q-R (in b) signals. The dashed boxes cover rotational transition frequencies f J,J′ from f 25,26 to f 37,38 .
c, d Enlarged views of the NR (c) and R (d) spectra within the dashed boxes in the NR quadrant (in a)
and R quadrant (in b) as functions of initial and final J quantum numbers along the vertical and horizontal axes, respectively. Third- and fifth-order off-diagonal peaks are separated from the diagonal peaks at
J-resolved positions. All of the spectra are normalized and plotted based on the color map shown. From
[31]
296
Reprinted from the journal
1 3
oscillations at the 1QC frequencies along the two time variables, and in this example
the frequencies are the same, such that Fourier transformation of the signal with
respect to both time variables yields J-state-resolved diagonal peaks at frequencies
= f = f J,J+1 = 2Bc(J + 1) in the 2D spectrum. In addition, for each excitation frequency = f J,J+1 = 2Bc(J + 1) , off-diagonal peaks are observed at detection frequencies f = f J−1,J = 2BcJ and f = f J+1,J+2 = 2Bc(J + 2) . The off-diagonal peaks
indicate that the first-order |J〉〈J + 1| coherences induced by THz pulse A are correlated not only to the third-order coherences |J〉〈J + 1| discussed above but also to
the third-order coherences |J − 1〉〈J| and |J + 1〉〈J + 2| involving two neighboring
J levels induced by pulse B. These spectral peaks are located at J-resolved positions as shown in the 2D J-number map plotted as a function of initial and final
rotational level J i and J f (related to frequencies variables by ν = 2Bc(J i + 1) and
f = 2Bc(J f + 1)) in Fig. 16c, d.
For 2Q and PP signals, pulse A interacts twice with the molecular dipoles to
produce either 2QCs |J〉〈J + 2| or populations |J + 1〉〈J + 1|, respectively. After
inter-pulse delay τ, pulse B interacts once with the dipoles to produce third-order
1QCs |J〉〈J + 1| that radiate the measured signals during time t. The 2Q signal field
E NL (τ, t) shows oscillations as a function of τ at the 2QC frequencies and oscillations as a function of t at the 1QC frequencies, giving rise to J-state-resolved peaks
at ν ≅ 2f. For PP signals, there is no coherence evolution during the inter-pulse delay
so the signal appears in the 2D spectrum at zero frequency along ν and at J-resolved
positions along f.
In addition to these third-order signals, fifth-order spectral peaks including 2Q-R
signals and off-diagonal NR and R signals coupling J and J ± 2 levels are also
observed. They originate from five THz field-dipole interactions, which are elaborated as follows. The 2Q-R peaks arise from two field interactions with pulse A
Fig. 16 a NR and b R (excitation frequency shown as positive) quadrants of the 2D spectrum of
CH 3 CN. Spectral amplitudes inside the red dashed area are magnified ×10 to bring out the 2Q (in a)
and 2Q-R (in b) signals. The dashed boxes cover rotational transition frequencies f J,J′ from f 25,26 to f 37,38 .
c, d Enlarged views of the NR (c) and R (d) spectra within the dashed boxes in the NR quadrant (in a)
and R quadrant (in b) as functions of initial and final J quantum numbers along the vertical and horizontal axes, respectively. Third- and fifth-order off-diagonal peaks are separated from the diagonal peaks at
J-resolved positions. All of the spectra are normalized and plotted based on the color map shown. From
[31]
296
Reprinted from the journal