

Top Curr Chem (Z) (2018) 376:6
1 3
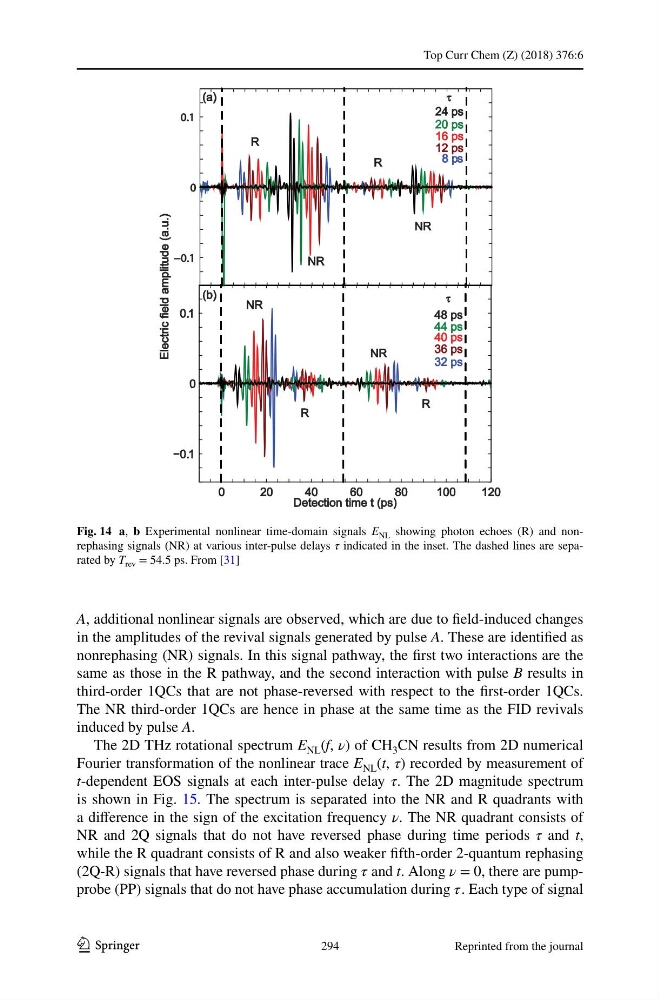
A, additional nonlinear signals are observed, which are due to field-induced changes
in the amplitudes of the revival signals generated by pulse A. These are identified as
nonrephasing (NR) signals. In this signal pathway, the first two interactions are the
same as those in the R pathway, and the second interaction with pulse B results in
third-order 1QCs that are not phase-reversed with respect to the first-order 1QCs.
The NR third-order 1QCs are hence in phase at the same time as the FID revivals
induced by pulse A.
The 2D THz rotational spectrum E NL (f, ν) of CH 3 CN results from 2D numerical
Fourier transformation of the nonlinear trace E NL (t, τ) recorded by measurement of
t-dependent EOS signals at each inter-pulse delay τ. The 2D magnitude spectrum
is shown in Fig. 15. The spectrum is separated into the NR and R quadrants with
a difference in the sign of the excitation frequency ν. The NR quadrant consists of
NR and 2Q signals that do not have reversed phase during time periods τ and t,
while the R quadrant consists of R and also weaker fifth-order 2-quantum rephasing
(2Q-R) signals that have reversed phase during and t. Along ν = 0, there are pumpprobe (PP) signals that do not have phase accumulation during . Each type of signal
Fig. 14 a, b Experimental nonlinear time-domain signals E NL showing photon echoes (R) and nonrephasing signals (NR) at various inter-pulse delays τ indicated in the inset. The dashed lines are separated by T rev = 54.5 ps. From [31]
294
Reprinted from the journal
1 3
A, additional nonlinear signals are observed, which are due to field-induced changes
in the amplitudes of the revival signals generated by pulse A. These are identified as
nonrephasing (NR) signals. In this signal pathway, the first two interactions are the
same as those in the R pathway, and the second interaction with pulse B results in
third-order 1QCs that are not phase-reversed with respect to the first-order 1QCs.
The NR third-order 1QCs are hence in phase at the same time as the FID revivals
induced by pulse A.
The 2D THz rotational spectrum E NL (f, ν) of CH 3 CN results from 2D numerical
Fourier transformation of the nonlinear trace E NL (t, τ) recorded by measurement of
t-dependent EOS signals at each inter-pulse delay τ. The 2D magnitude spectrum
is shown in Fig. 15. The spectrum is separated into the NR and R quadrants with
a difference in the sign of the excitation frequency ν. The NR quadrant consists of
NR and 2Q signals that do not have reversed phase during time periods τ and t,
while the R quadrant consists of R and also weaker fifth-order 2-quantum rephasing
(2Q-R) signals that have reversed phase during and t. Along ν = 0, there are pumpprobe (PP) signals that do not have phase accumulation during . Each type of signal
Fig. 14 a, b Experimental nonlinear time-domain signals E NL showing photon echoes (R) and nonrephasing signals (NR) at various inter-pulse delays τ indicated in the inset. The dashed lines are separated by T rev = 54.5 ps. From [31]
294
Reprinted from the journal