

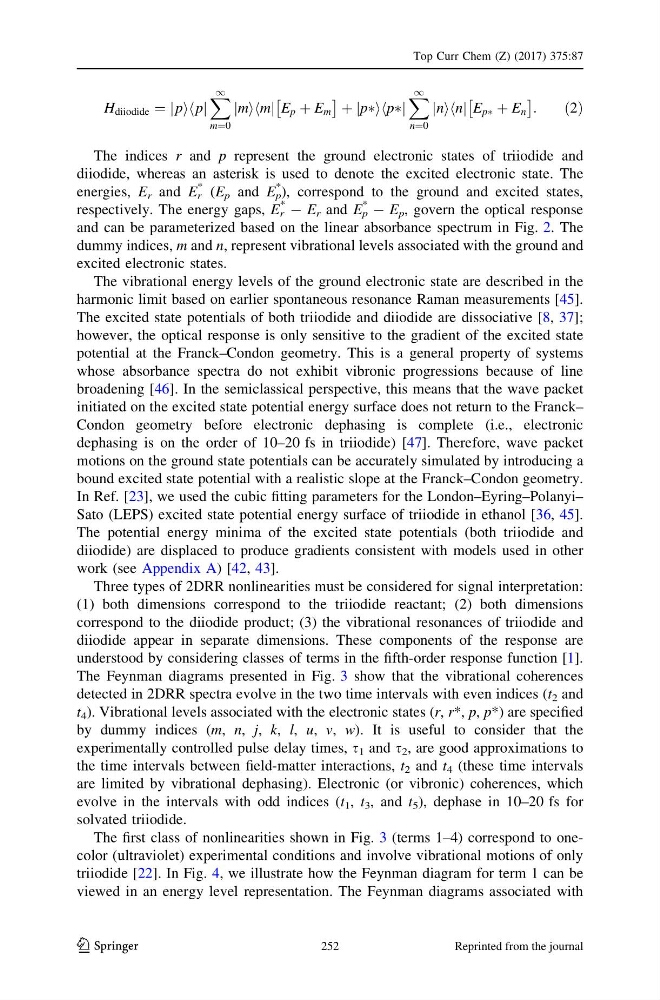
H diiodide ¼ p
j i p
h j
X 1
m¼0
m
j i m
h j E p þ E m
Â
Ã
þ pÃ
j i pÃ
h j
X 1
n¼0
n
j i n
h j E pà þ E n
Â
Ã
:
ð2Þ
The indices r and p represent the ground electronic states of triiodide and
diiodide, whereas an asterisk is used to denote the excited electronic state. The
energies, E r and E r
* (E p and E p
* ), correspond to the ground and excited states,
respectively. The energy gaps, E r
* - E r and E p
* - E p , govern the optical response
and can be parameterized based on the linear absorbance spectrum in Fig. 2. The
dummy indices, m and n, represent vibrational levels associated with the ground and
excited electronic states.
The vibrational energy levels of the ground electronic state are described in the
harmonic limit based on earlier spontaneous resonance Raman measurements [45].
The excited state potentials of both triiodide and diiodide are dissociative [8, 37];
however, the optical response is only sensitive to the gradient of the excited state
potential at the Franck–Condon geometry. This is a general property of systems
whose absorbance spectra do not exhibit vibronic progressions because of line
broadening [46]. In the semiclassical perspective, this means that the wave packet
initiated on the excited state potential energy surface does not return to the Franck–
Condon geometry before electronic dephasing is complete (i.e., electronic
dephasing is on the order of 10–20 fs in triiodide) [47]. Therefore, wave packet
motions on the ground state potentials can be accurately simulated by introducing a
bound excited state potential with a realistic slope at the Franck–Condon geometry.
In Ref. [23], we used the cubic fitting parameters for the London–Eyring–Polanyi–
Sato (LEPS) excited state potential energy surface of triiodide in ethanol [36, 45].
The potential energy minima of the excited state potentials (both triiodide and
diiodide) are displaced to produce gradients consistent with models used in other
work (see Appendix A) [42, 43].
Three types of 2DRR nonlinearities must be considered for signal interpretation:
(1) both dimensions correspond to the triiodide reactant; (2) both dimensions
correspond to the diiodide product; (3) the vibrational resonances of triiodide and
diiodide appear in separate dimensions. These components of the response are
understood by considering classes of terms in the fifth-order response function [1].
The Feynman diagrams presented in Fig. 3 show that the vibrational coherences
detected in 2DRR spectra evolve in the two time intervals with even indices (t 2 and
t 4 ). Vibrational levels associated with the electronic states (r, r*, p, p*) are specified
by dummy indices (m, n, j, k, l, u, v, w). It is useful to consider that the
experimentally controlled pulse delay times, s 1 and s 2 , are good approximations to
the time intervals between field-matter interactions, t 2 and t 4 (these time intervals
are limited by vibrational dephasing). Electronic (or vibronic) coherences, which
evolve in the intervals with odd indices (t 1 , t 3 , and t 5 ), dephase in 10–20 fs for
solvated triiodide.
The first class of nonlinearities shown in Fig. 3 (terms 1–4) correspond to onecolor (ultraviolet) experimental conditions and involve vibrational motions of only
triiodide [22]. In Fig. 4, we illustrate how the Feynman diagram for term 1 can be
viewed in an energy level representation. The Feynman diagrams associated with
Top Curr Chem (Z) (2017) 375:87
123
252
Reprinted from the journal
j i p
h j
X 1
m¼0
m
j i m
h j E p þ E m
Â
Ã
þ pÃ
j i pÃ
h j
X 1
n¼0
n
j i n
h j E pà þ E n
Â
Ã
:
ð2Þ
The indices r and p represent the ground electronic states of triiodide and
diiodide, whereas an asterisk is used to denote the excited electronic state. The
energies, E r and E r
* (E p and E p
* ), correspond to the ground and excited states,
respectively. The energy gaps, E r
* - E r and E p
* - E p , govern the optical response
and can be parameterized based on the linear absorbance spectrum in Fig. 2. The
dummy indices, m and n, represent vibrational levels associated with the ground and
excited electronic states.
The vibrational energy levels of the ground electronic state are described in the
harmonic limit based on earlier spontaneous resonance Raman measurements [45].
The excited state potentials of both triiodide and diiodide are dissociative [8, 37];
however, the optical response is only sensitive to the gradient of the excited state
potential at the Franck–Condon geometry. This is a general property of systems
whose absorbance spectra do not exhibit vibronic progressions because of line
broadening [46]. In the semiclassical perspective, this means that the wave packet
initiated on the excited state potential energy surface does not return to the Franck–
Condon geometry before electronic dephasing is complete (i.e., electronic
dephasing is on the order of 10–20 fs in triiodide) [47]. Therefore, wave packet
motions on the ground state potentials can be accurately simulated by introducing a
bound excited state potential with a realistic slope at the Franck–Condon geometry.
In Ref. [23], we used the cubic fitting parameters for the London–Eyring–Polanyi–
Sato (LEPS) excited state potential energy surface of triiodide in ethanol [36, 45].
The potential energy minima of the excited state potentials (both triiodide and
diiodide) are displaced to produce gradients consistent with models used in other
work (see Appendix A) [42, 43].
Three types of 2DRR nonlinearities must be considered for signal interpretation:
(1) both dimensions correspond to the triiodide reactant; (2) both dimensions
correspond to the diiodide product; (3) the vibrational resonances of triiodide and
diiodide appear in separate dimensions. These components of the response are
understood by considering classes of terms in the fifth-order response function [1].
The Feynman diagrams presented in Fig. 3 show that the vibrational coherences
detected in 2DRR spectra evolve in the two time intervals with even indices (t 2 and
t 4 ). Vibrational levels associated with the electronic states (r, r*, p, p*) are specified
by dummy indices (m, n, j, k, l, u, v, w). It is useful to consider that the
experimentally controlled pulse delay times, s 1 and s 2 , are good approximations to
the time intervals between field-matter interactions, t 2 and t 4 (these time intervals
are limited by vibrational dephasing). Electronic (or vibronic) coherences, which
evolve in the intervals with odd indices (t 1 , t 3 , and t 5 ), dephase in 10–20 fs for
solvated triiodide.
The first class of nonlinearities shown in Fig. 3 (terms 1–4) correspond to onecolor (ultraviolet) experimental conditions and involve vibrational motions of only
triiodide [22]. In Fig. 4, we illustrate how the Feynman diagram for term 1 can be
viewed in an energy level representation. The Feynman diagrams associated with
Top Curr Chem (Z) (2017) 375:87
123
252
Reprinted from the journal