

1 3
Top Curr Chem (Z) (2018) 376:24
fluorescence lifetime and high fluorescence quantum yields [88]. It is used to
probe solvent polarity [89] and constitutes the basis of commercial dyes, fluorescence probes for electro-chemiluminescence and many larger photoactive molecules
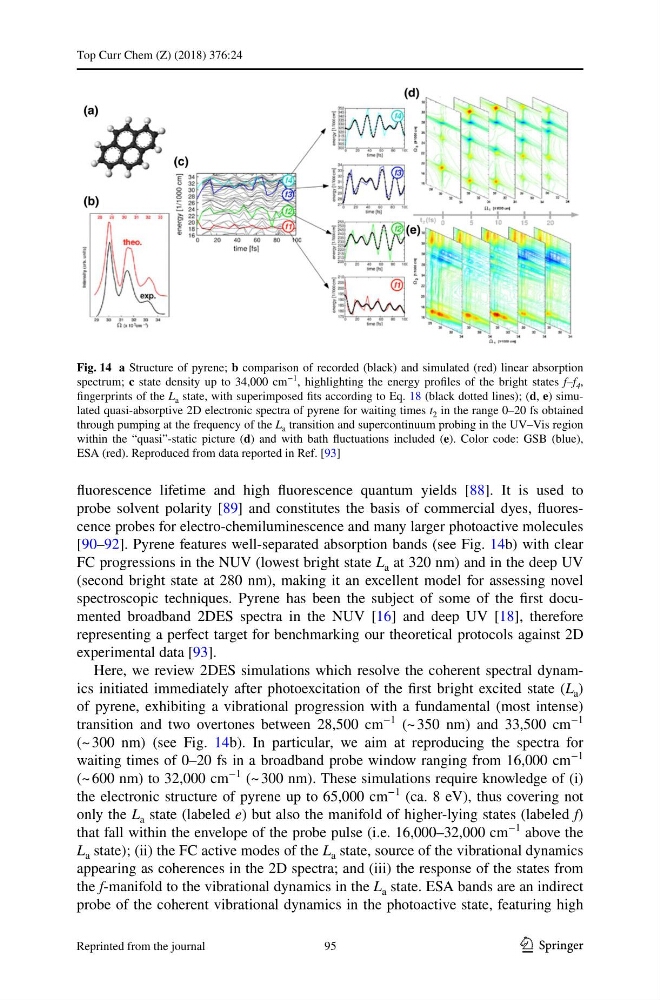
[90–92]. Pyrene features well-separated absorption bands (see Fig. 14b) with clear
FC progressions in the NUV (lowest bright state L a at 320 nm) and in the deep UV
(second bright state at 280 nm), making it an excellent model for assessing novel
spectroscopic techniques. Pyrene has been the subject of some of the first documented broadband 2DES spectra in the NUV [16] and deep UV [18], therefore
representing a perfect target for benchmarking our theoretical protocols against 2D
experimental data [93].
Here, we review 2DES simulations which resolve the coherent spectral dynamics initiated immediately after photoexcitation of the first bright excited state (L a )
of pyrene, exhibiting a vibrational progression with a fundamental (most intense)
transition and two overtones between 28,500 cm
−1
(~ 350 nm) and 33,500 cm
−1
(~ 300 nm) (see Fig. 14b). In particular, we aim at reproducing the spectra for
waiting times of 0–20 fs in a broadband probe window ranging from 16,000 cm
−1
(~ 600 nm) to 32,000 cm
−1
(~ 300 nm). These simulations require knowledge of (i)
the electronic structure of pyrene up to 65,000 cm
−1
(ca. 8 eV), thus covering not
only the L a state (labeled e) but also the manifold of higher-lying states (labeled f)
that fall within the envelope of the probe pulse (i.e. 16,000–32,000 cm
−1
above the
L a state); (ii) the FC active modes of the L a state, source of the vibrational dynamics
appearing as coherences in the 2D spectra; and (iii) the response of the states from
the f-manifold to the vibrational dynamics in the L a state. ESA bands are an indirect
probe of the coherent vibrational dynamics in the photoactive state, featuring high
Fig. 14 a Structure of pyrene; b comparison of recorded (black) and simulated (red) linear absorption
spectrum; c state density up to 34,000 cm
−1 , highlighting the energy profiles of the bright states f–f 4 ,
fingerprints of the L a state, with superimposed fits according to Eq. 18 (black dotted lines); (d, e) simulated quasi-absorptive 2D electronic spectra of pyrene for waiting times t 2 in the range 0–20 fs obtained
through pumping at the frequency of the L a transition and supercontinuum probing in the UV–Vis region
within the “quasi”-static picture (d) and with bath fluctuations included (e). Color code: GSB (blue),
ESA (red). Reproduced from data reported in Ref. [93]
95
Reprinted from the journal
Top Curr Chem (Z) (2018) 376:24
fluorescence lifetime and high fluorescence quantum yields [88]. It is used to
probe solvent polarity [89] and constitutes the basis of commercial dyes, fluorescence probes for electro-chemiluminescence and many larger photoactive molecules
[90–92]. Pyrene features well-separated absorption bands (see Fig. 14b) with clear
FC progressions in the NUV (lowest bright state L a at 320 nm) and in the deep UV
(second bright state at 280 nm), making it an excellent model for assessing novel
spectroscopic techniques. Pyrene has been the subject of some of the first documented broadband 2DES spectra in the NUV [16] and deep UV [18], therefore
representing a perfect target for benchmarking our theoretical protocols against 2D
experimental data [93].
Here, we review 2DES simulations which resolve the coherent spectral dynamics initiated immediately after photoexcitation of the first bright excited state (L a )
of pyrene, exhibiting a vibrational progression with a fundamental (most intense)
transition and two overtones between 28,500 cm
−1
(~ 350 nm) and 33,500 cm
−1
(~ 300 nm) (see Fig. 14b). In particular, we aim at reproducing the spectra for
waiting times of 0–20 fs in a broadband probe window ranging from 16,000 cm
−1
(~ 600 nm) to 32,000 cm
−1
(~ 300 nm). These simulations require knowledge of (i)
the electronic structure of pyrene up to 65,000 cm
−1
(ca. 8 eV), thus covering not
only the L a state (labeled e) but also the manifold of higher-lying states (labeled f)
that fall within the envelope of the probe pulse (i.e. 16,000–32,000 cm
−1
above the
L a state); (ii) the FC active modes of the L a state, source of the vibrational dynamics
appearing as coherences in the 2D spectra; and (iii) the response of the states from
the f-manifold to the vibrational dynamics in the L a state. ESA bands are an indirect
probe of the coherent vibrational dynamics in the photoactive state, featuring high
Fig. 14 a Structure of pyrene; b comparison of recorded (black) and simulated (red) linear absorption
spectrum; c state density up to 34,000 cm
−1 , highlighting the energy profiles of the bright states f–f 4 ,
fingerprints of the L a state, with superimposed fits according to Eq. 18 (black dotted lines); (d, e) simulated quasi-absorptive 2D electronic spectra of pyrene for waiting times t 2 in the range 0–20 fs obtained
through pumping at the frequency of the L a transition and supercontinuum probing in the UV–Vis region
within the “quasi”-static picture (d) and with bath fluctuations included (e). Color code: GSB (blue),
ESA (red). Reproduced from data reported in Ref. [93]
95
Reprinted from the journal