

664
drone ascends and decreases as it descends. During these motions, the drone also accelerates
to reach its maximum speed in a vertical direction. The horizontal speed data generated due
to GPS errors has been filtered. During the horizontal motions with constant altitude, the
power consumption is relatively stable. The power consumption between the two motions has
also been recorded which account for the hovering motion.
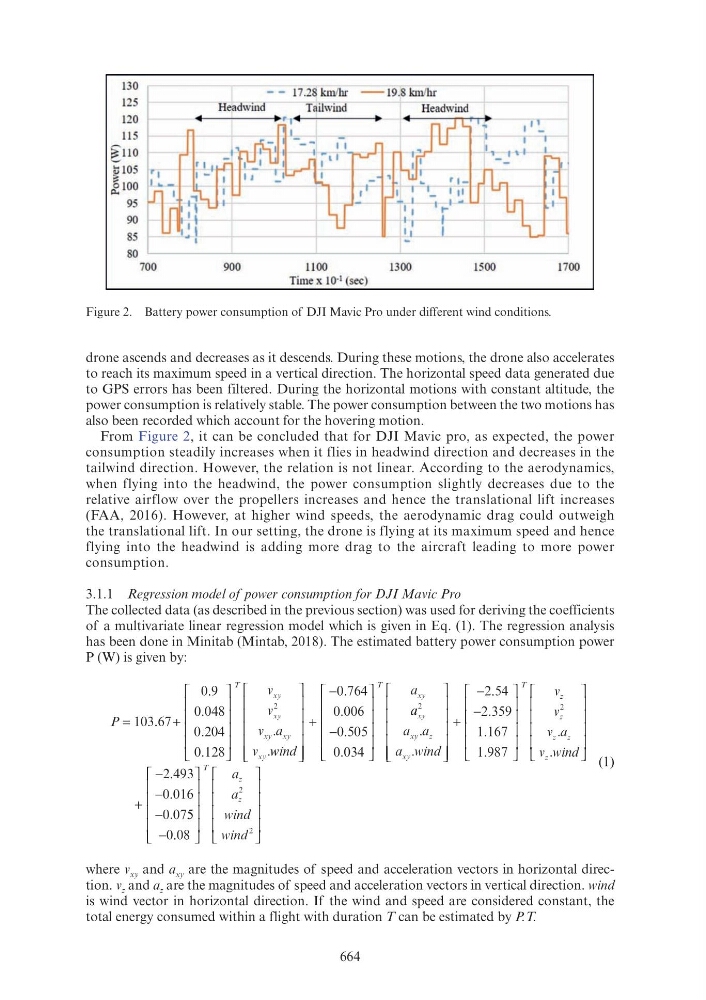
From Figure 2, it can be concluded that for DJI Mavic pro, as expected, the power
consumption steadily increases when it flies in headwind direction and decreases in the
tailwind direction. However, the relation is not linear. According to the aerodynamics,
when flying into the headwind, the power consumption slightly decreases due to the
relative airflow over the propellers increases and hence the translational lift increases
(FAA, 2016). However, at higher wind speeds, the aerodynamic drag could outweigh
the translational lift. In our setting, the drone is flying at its maximum speed and hence
flying into the headwind is adding more drag to the aircraft leading to more power
consumption.
3.1.1 Regression model of power consumption for DJI Mavic Pro
The collected data (as described in the previous section) was used for deriving the coefficients
of a multivariate linear regression model which is given in Eq. (1). The regression analysis
has been done in Minitab (Mintab, 2018). The estimated battery power consumption power
P (W) is given by:
P
v
v
v a
v
T
xy
xy
xy xy
xy
=
+
⎡
⎣
⎢
⎡ ⎡
⎢
⎢ ⎢
⎢
⎢ ⎢
⎢
⎣ ⎣
⎢ ⎢
⎤
⎦
⎥
⎤ ⎤
⎥
⎥ ⎥
⎥
⎥ ⎥
⎥
⎦ ⎦
⎥ ⎥
103 67
0 9
0 048
0 204
0 128
2
.
.
.
.
.
.
.wi w w nd
i i
a
T
xy
⎡
⎣
⎢
⎡ ⎡
⎢
⎢ ⎢
⎢
⎢ ⎢
⎢
⎢ ⎢
⎢ ⎣ ⎣
⎢ ⎢
⎤
⎦
⎥
⎤ ⎤
⎥
⎥ ⎥
⎥
⎥ ⎥
⎥
⎥ ⎥
⎥ ⎦ ⎦
⎥ ⎥
+
−
−
⎡
⎣
⎢
⎡ ⎡
⎢
⎢ ⎢
⎢
⎢ ⎢
⎢
⎣ ⎣
⎢ ⎢
⎤
⎦
⎥
⎤ ⎤
⎥
⎥ ⎥
⎥
⎥ ⎥
⎥
⎦ ⎦
⎥ ⎥
0 764
0 006
0 505
0 034
.
.
.
.
a a
a a
a wind
xy
xy z
xy
2
2 54
2 359
1 167
1 987
.
.
.
.
.
.
⎡
⎣
⎢
⎡ ⎡
⎢
⎢ ⎢
⎢
⎢ ⎢
⎢
⎢ ⎢
⎢ ⎣ ⎣
⎢ ⎢
⎤
⎦
⎥
⎤ ⎤
⎥
⎥ ⎥
⎥
⎥ ⎥
⎥
⎥ ⎥
⎥ ⎦ ⎦
⎥ ⎥
+
−
−
⎡
⎣
⎢
⎡ ⎡
⎢ ⎢
⎢ ⎢ ⎢ ⎢
⎢
⎢ ⎢ ⎢ ⎢
⎢
⎣ ⎣
⎢ ⎢
⎤
⎦
⎥
⎤ ⎤
⎥
⎥ ⎥
⎥
⎥ ⎥
⎥
⎦ ⎦
⎥ ⎥
⎡
⎣
⎢
⎡ ⎡
⎢
⎢ ⎢
⎢
⎢ ⎢
⎢
⎣ ⎣
⎢ ⎢
⎤
⎦
⎥
⎤ ⎤
⎥
⎥ ⎥
⎥
⎥ ⎥
⎥
⎦ ⎦
⎥ ⎥
+
−
−
−
T
z
z
z z
z
v
v
v a
z
v w
z
ind
2
2 493
0 016
0 0
.
.
.
. 5
075 5 5
0 08
2
2
−
⎡
⎣
⎢
⎡ ⎡
⎢
⎢ ⎢
⎢
⎢ ⎢
⎢
⎣ ⎣
⎢ ⎢
⎤
⎦
⎥
⎤ ⎤
⎥
⎥ ⎥
⎥
⎥ ⎥
⎥
⎦ ⎦
⎥ ⎥
⎡
⎣
⎢
⎡ ⎡
⎢
⎢ ⎢
⎢
⎢ ⎢
⎢
⎣ ⎣
⎢ ⎢
⎤
⎦
⎥
⎤ ⎤
⎥
⎥ ⎥
⎥
⎥ ⎥
⎥
⎦ ⎦
⎥ ⎥
.
T
z
z
a
a
wind i i
wind i i
(1)
where v xy and a xy are the magnitudes of speed and acceleration vectors in horizontal direction. v z and a z are the magnitudes of speed and acceleration vectors in vertical direction. wind
is wind vector in horizontal direction. If the wind and speed are considered constant, the
total energy consumed within a flight with duration T can be estimated by P.T.
Figure 2. Battery power consumption of DJI Mavic Pro under different wind conditions.
130
125
120
115
~ 1 10
il l 05
:;;
& 100
95
90
85
80
700
900
1100
1300
1500
1700
Timex I0- 1 (sec)