

658
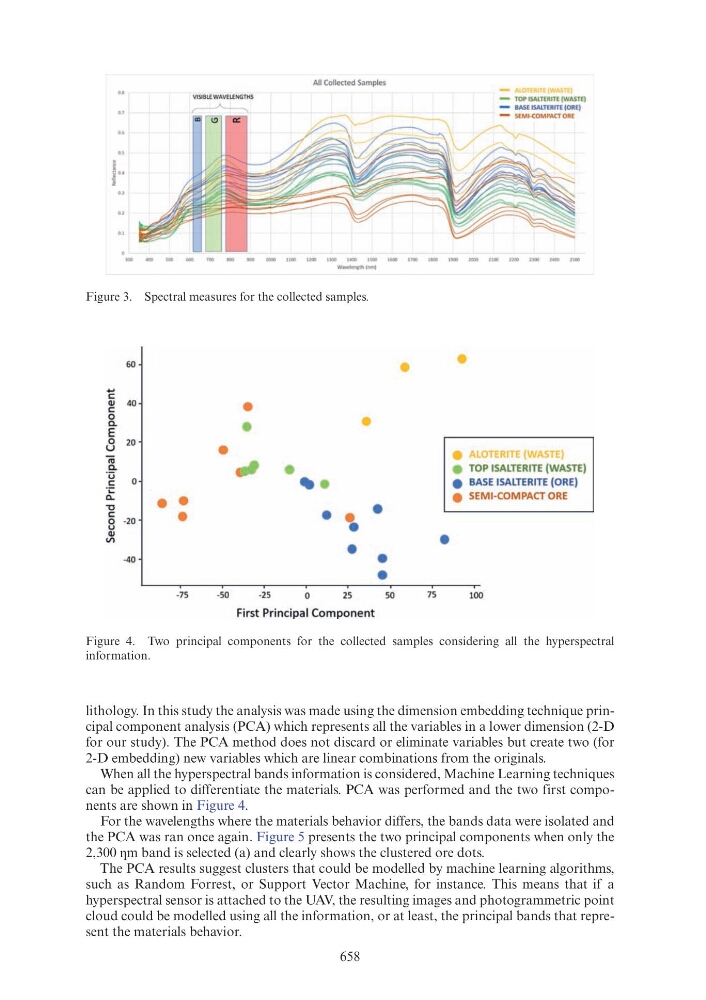
Figure 3. Spectral measures for the collected samples.
Figure 4. Two principal components for the collected samples considering all the hyperspectral
information.
lithology. In this study the analysis was made using the dimension embedding technique principal component analysis (PCA) which represents all the variables in a lower dimension (2-D
for our study). The PCA method does not discard or eliminate variables but create two (for
2-D embedding) new variables which are linear combinations from the originals.
When all the hyperspectral bands information is considered, Machine Learning techniques
can be applied to differentiate the materials. PCA was performed and the two first components are shown in Figure 4.
For the wavelengths where the materials behavior differs, the bands data were isolated and
the PCA was ran once again. Figure 5 presents the two principal components when only the
2,300 m band is selected (a) and clearly shows the clustered ore dots.
The PCA results suggest clusters that could be modelled by machine learning algorithms,
such as Random Forrest, or Support Vector Machine, for instance. This means that if a
hyperspectral sensor is attached to the UAV, the resulting images and photogrammetric point
cloud could be modelled using all the information, or at least, the principal bands that represent the materials behavior.
..... c
Q)
c
0
a_
E
0
u
Iii a_
·u
c
·;::
c..
-o
c
0
u
Q)
V)
' "'
-40• •
•
-75
All Col lected Samples
-
ALOTI m (WASTE)
VISIBLE WAVELENGTHS
-
TOP ISALTERITE (WASTE)
•
-50
-
BASE ISALTERITI.(ORE)
-
SEMI-COMPACT ORE
- --- -------- - - - - -
W.wtlt"ith (nm)
• •
•
•
•
• ALOTERITE (WASTE)
fll •
• TOP ISALTERITE (WASTE)
-·
• BASE ISALTERITE (ORE)
• SEMI-COMPACT ORE
• \ • •
• • •
-25
0
25
50
75
100
First Principal Component