

657
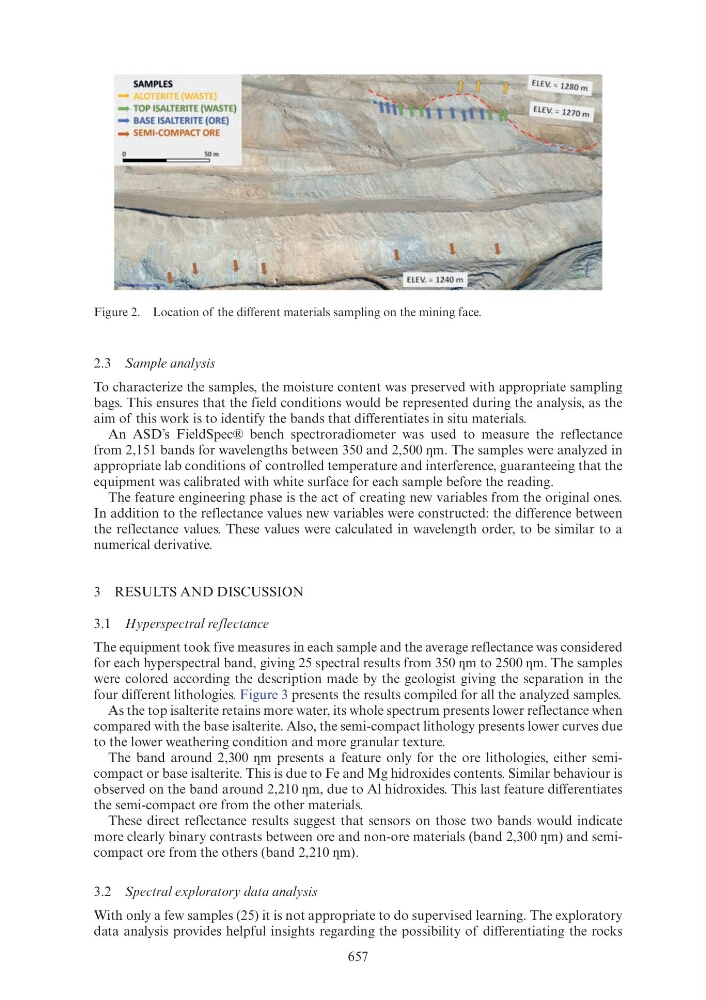
2.3 Sample analysis
To characterize the samples, the moisture content was preserved with appropriate sampling
bags. This ensures that the field conditions would be represented during the analysis, as the
aim of this work is to identify the bands that differentiates in situ materials.
An ASD’s FieldSpec® bench spectroradiometer was used to measure the reflectance
from 2,151 bands for wavelengths between 350 and 2,500 m. The samples were analyzed in
appropriate lab conditions of controlled temperature and interference, guaranteeing that the
equipment was calibrated with white surface for each sample before the reading.
The feature engineering phase is the act of creating new variables from the original ones.
In addition to the reflectance values new variables were constructed: the difference between
the reflectance values. These values were calculated in wavelength order, to be similar to a
numerical derivative.
3 RESULTS AND DISCUSSION
3.1 Hyperspectral reflectance
The equipment took five measures in each sample and the average reflectance was considered
for each hyperspectral band, giving 25 spectral results from 350 m to 2500 m. The samples
were colored according the description made by the geologist giving the separation in the
four different lithologies. Figure 3 presents the results compiled for all the analyzed samples.
As the top isalterite retains more water, its whole spectrum presents lower reflectance when
compared with the base isalterite. Also, the semi-compact lithology presents lower curves due
to the lower weathering condition and more granular texture.
The band around 2,300 m presents a feature only for the ore lithologies, either semicompact or base isalterite. This is due to Fe and Mg hidroxides contents. Similar behaviour is
observed on the band around 2,210 m, due to Al hidroxides. This last feature differentiates
the semi-compact ore from the other materials.
These direct reflectance results suggest that sensors on those two bands would indicate
more clearly binary contrasts between ore and non-ore materials (band 2,300 m) and semicompact ore from the others (band 2,210 m).
3.2 Spectral exploratory data analysis
With only a few samples (25) it is not appropriate to do supervised learning. The exploratory
data analysis provides helpful insights regarding the possibility of differentiating the rocks
Figure 2. Location of the different materials sampling on the mining face.
SAMPLES
.... TOP ISALTERITE {WASTE)
..,. BASE ISALTERITE (ORE)
- SEMI-COMPACT ORE