

623
150. In the CFD models, methane was emitted from the exposed coal face area only. In future
models, researchers will include methane emissions from the freshly cut coal on the face conveyor as well as emissions from the gob. The CFD models include realistically represented
cutting drums that rotate but do not yet include water sprays. Fresh air entering the longwall
face is assumed to have no methane.
From the CFD models, researchers note several key observations about the methane distribution in the tailgate area of the longwall face:
1. Methane concentration increases over the length of the face from headgate to tailgate,
following the ventilation air stream. This is caused by two additive effects: the face air
quantity decreases over the length of the face because some air leaks into the bleeder ventilated gob. At the same time, methane emissions along the face are cumulative, leading
to increasing methane volume over the length of the face. Researchers note that methane
distribution may be different for progressively sealed or bleederless gobs as the leakage
patterns are different, but the general trend of increasing methane concentrations from
headgate to tailgate remains.
2. Referring to Figures 3 and 4, the average methane concentrations are lowest in zone M1.
This is expected as M1 is farthest away from the methane source. Based on the CFD
model, machine-mounted sensor readings in zone M2 may read 2 to 7 times higher than
concentrations measured with handheld instruments in zone M1 at the same shield location. Researchers have yet to study the impact of boundary layer effects on top of the
shearer body to determine their impact on machine sensor readings.
3. Methane concentrations in zone M3 are highest. It should be noted that both M3 locations coexist on the longwall face. M3 is assumed to always be in the top left corner of the
face, as viewed from the headgate, but its distance to the other zones varies depending on
the shearer cut. Both M3 locations are represented in the graph in Figure 4. The M3 location shifts as the shearer cuts, until the shields advance following the shearer cut.
4. Based on the CFD model, methane concentrations in zone M3 are 3 to 30 times higher
than those measured in M1. In the current scenario, a handheld examination under shield
no. 140 would read 0.6% methane while the concentration in the shearer cutting zone M3
exceeds 4%. It is likely that the shearer would not alarm as it travels towards the tailgate
past shield no. 140 where the M2 average does not exceed 1.5%.
5. The peak methane concentration in Zone 3 occurs around shield 140. Methane concentration drops towards the tailgate because the shearer partially obstructs the airflow and
increases turbulent mixing and dilution. In addition, the gob plate that prevents gob rubble from entering the face at the tailgate, further obstructs the flow and increases face air
velocity, as the inset in Figure 2 shows.
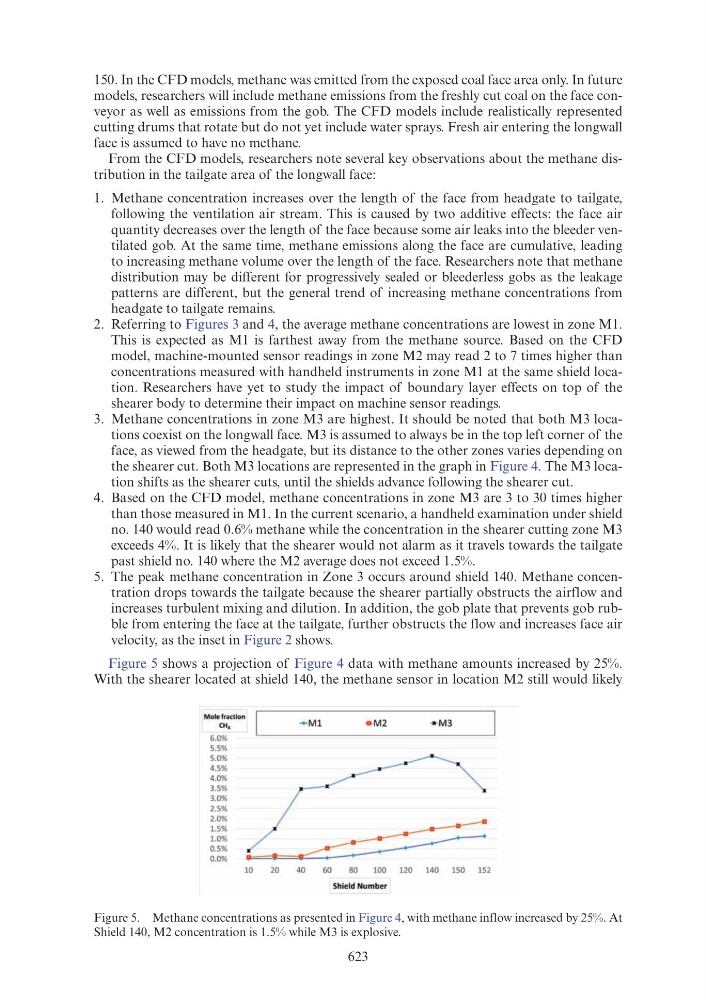
Figure 5 shows a projection of Figure 4 data with methane amounts increased by 25%.
With the shearer located at shield 140, the methane sensor in location M2 still would likely
Figure 5. Methane concentrations as presented in Figure 4, with methane inflow increased by 25%. At
Shield 140, M2 concentration is 1.5% while M3 is explosive.
Mole fraction
CH,
+ Ml
• M2
·• M 3
6.0%
5.5%
5.0%
4.5%
4.0%
3.5%
3.0%
2.5%
2.0%
1.5%
1.0%
0.5%
0.0%
10
20
40
60
80
100
120
140
150
152
Shield Number