

616
size of dust particles was far smaller compared with that of the roadway, all the dust particles
had been amplified for better observation. For the purpose of better understanding the dust
distribution characteristics, the projection of dust distribution in the XY plane and ZY plane
are presented in Figure 7 and Figure 8 respectively.
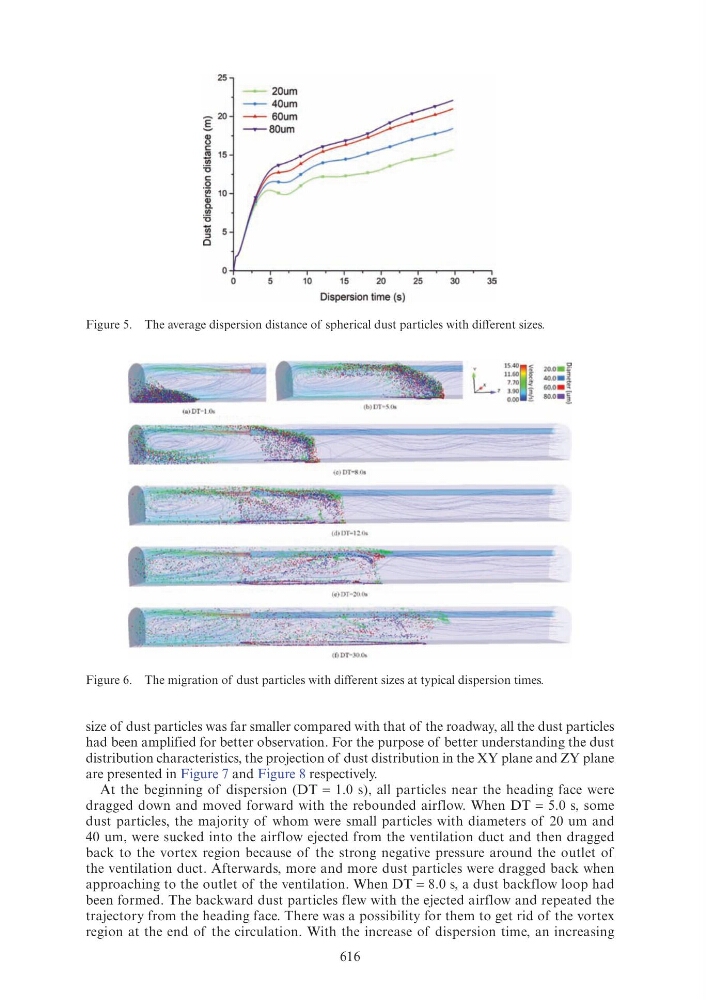
At the beginning of dispersion (DT = 1.0 s), all particles near the heading face were
dragged down and moved forward with the rebounded airflow. When DT = 5.0 s, some
dust particles, the majority of whom were small particles with diameters of 20 um and
40 um, were sucked into the airflow ejected from the ventilation duct and then dragged
back to the vortex region because of the strong negative pressure around the outlet of
the ventilation duct. Afterwards, more and more dust particles were dragged back when
approaching to the outlet of the ventilation. When DT = 8.0 s, a dust backflow loop had
been formed. The backward dust particles flew with the ejected airflow and repeated the
trajectory from the heading face. There was a possibility for them to get rid of the vortex
region at the end of the circulation. With the increase of dispersion time, an increasing
Figure 5. The average dispersion distance of spherical dust particles with different sizes.
Figure 6. The migration of dust particles with different sizes at typical dispersion times.
25
-
20um
I
20
Q)
u
c
"'
15
t)
'5
c
_Q
~ 10
Q)
a.
(/)
'5
t)
:::>
0
0
0
5
10
15
20
25
30
35
Dispersion time (s)
'
15.40
~
20.0 - ~
L,
11.60
40.0 . ~
7.70
"
60.0 . ~
3.90 3
so. o• l
0.00 ;;:
(a) DT• I.Os
(c) DT-8 Os
(d) DT-12 0ol.
(OOT-300.