

615
where the airflow was somewhat disordered and decelerated continuously. Eventually, the
airflow decelerated to the lowest level of less than 0.5m/s, becoming stable and parallel to the
axes of the roadway in the stable region.
As shown in Figure 3, in the vortex region, the ejected air resulted in the high-speed airflow concentration in front of the outlet of the ventilation duct, then the rebounded airflow formed another high-speed airflow concentration in the lower area close to the floor
(Z = 5.0 m). In the turbulence region, high-speed airflow firstly concentrated at the side opposite to the ventilation duct and then migrated to the upper area of the roadway (Z = 15.0 m
and Z = 20.0 m). In the stable region, the velocity of airflow had been slowed down to the
lowest level (Z = 30.0 m and Z = 35.0 m).
3.2 Migration of particles with different sizes
In the numerical model, the positive direction of the Z axis denotes the direction from the
heading face to the roadway exit along the long axis of the roadway. Therefore, the dispersion velocity for different kinds of dust particles was defined as their average Z velocity. The
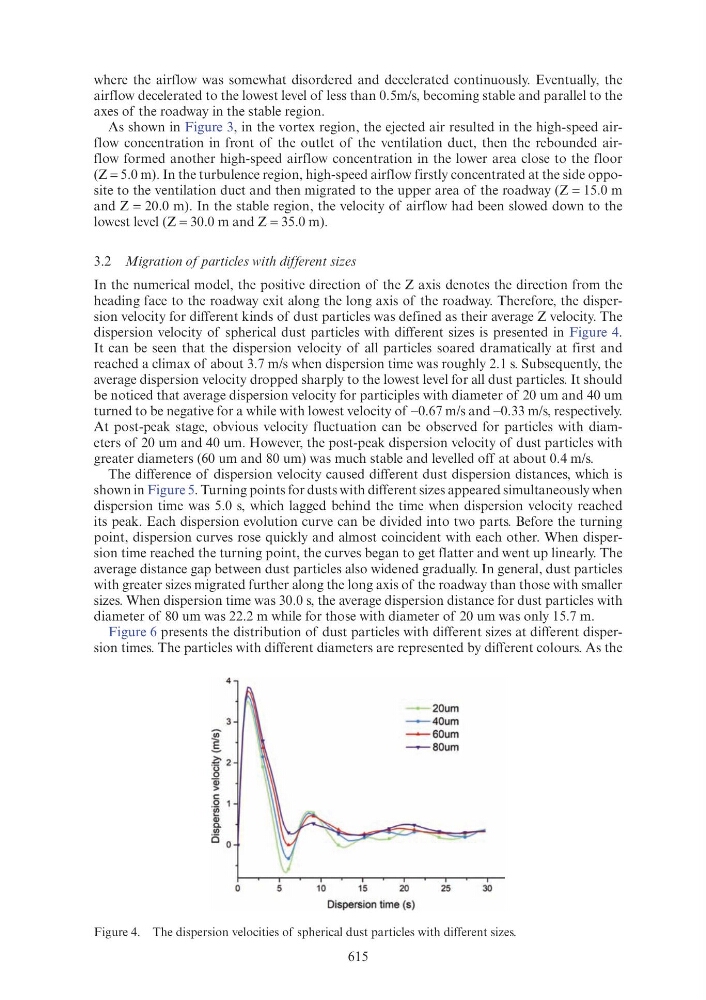
dispersion velocity of spherical dust particles with different sizes is presented in Figure 4.
It can be seen that the dispersion velocity of all particles soared dramatically at first and
reached a climax of about 3.7 m/s when dispersion time was roughly 2.1 s. Subsequently, the
average dispersion velocity dropped sharply to the lowest level for all dust particles. It should
be noticed that average dispersion velocity for participles with diameter of 20 um and 40 um
turned to be negative for a while with lowest velocity of −0.67 m/s and −0.33 m/s, respectively.
At post-peak stage, obvious velocity fluctuation can be observed for particles with diameters of 20 um and 40 um. However, the post-peak dispersion velocity of dust particles with
greater diameters (60 um and 80 um) was much stable and levelled off at about 0.4 m/s.
The difference of dispersion velocity caused different dust dispersion distances, which is
shown in Figure 5. Turning points for dusts with different sizes appeared simultaneously when
dispersion time was 5.0 s, which lagged behind the time when dispersion velocity reached
its peak. Each dispersion evolution curve can be divided into two parts. Before the turning
point, dispersion curves rose quickly and almost coincident with each other. When dispersion time reached the turning point, the curves began to get flatter and went up linearly. The
average distance gap between dust particles also widened gradually. In general, dust particles
with greater sizes migrated further along the long axis of the roadway than those with smaller
sizes. When dispersion time was 30.0 s, the average dispersion distance for dust particles with
diameter of 80 um was 22.2 m while for those with diameter of 20 um was only 15.7 m.
Figure 6 presents the distribution of dust particles with different sizes at different dispersion times. The particles with different diameters are represented by different colours. As the
Figure 4. The dispersion velocities of spherical dust particles with different sizes.
4
-
20um
-
40um
- - 60um
____,....._ 80um
0
5
10
15
20
25
30
Dispersion time (s)