

614
(width × height × length). Single-forced ventilation system was used for dust removal in the
roadway. The ventilation duct with a diameter of 0.6 m, whose centre axis was 2.6 m away
from the floor and 1.2 m away from the tunnel centre axis along Z axis, was 10.0 m away
from the heading face. Forced air capacity was 260 m
3 /min, affording a ventilation velocity
of 15.33 m/s. The initial dusts were assumed to be distributed statically and uniformly inside
the dust zone within 1.0 m of the heading face.
The time-step, which has a positive correlation with particle’s size and density and a negative correlation with particle’s stiffness, must be small enough for an accurate result. In this
study, the DEM time-step was set as 1.2 × 10
−7 s in accordance with the smallest particle.
k-ε model was used to describe the air turbulent flow in the airflow field. The interaction of
particle to particle was described by the Hertz-Mindlin (no slip) model and the interaction
between particles and wall by the Hertz-Mindlin with JKR model. Other key parameters
are listed in Table 1. Before CFD-DEM coupling with dust created, the ventilation was performed for 120 seconds and the airflow field was stable.
3 ANALYSIS OF RESULTS
3.1 Airflow field
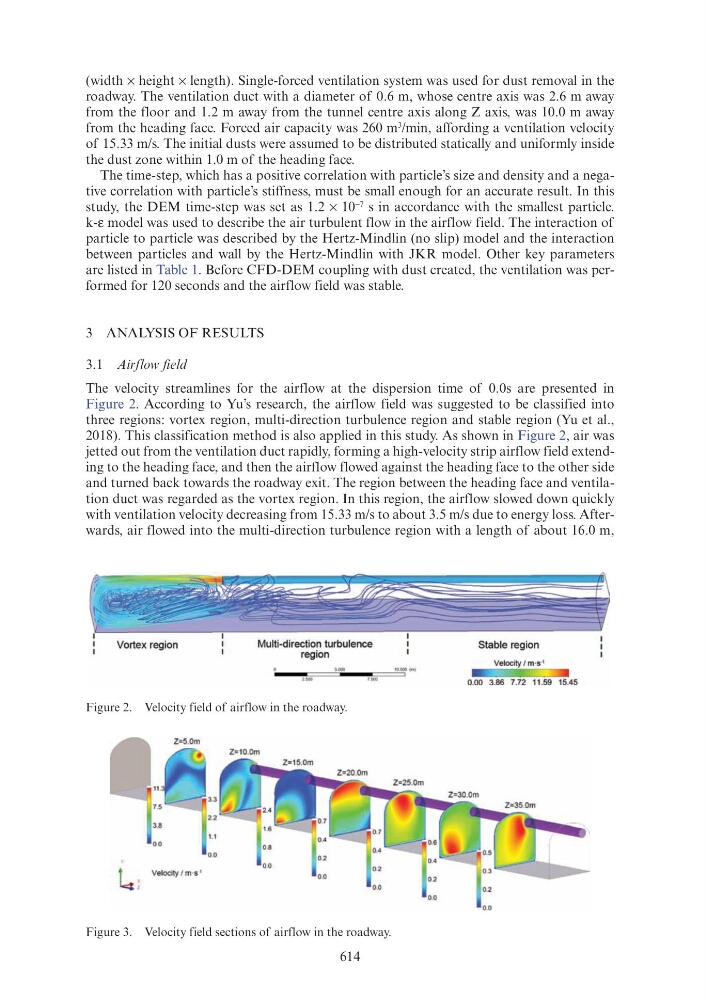
The velocity streamlines for the airflow at the dispersion time of 0.0s are presented in
Figure 2. According to Yu’s research, the airflow field was suggested to be classified into
three regions: vortex region, multi-direction turbulence region and stable region (Yu et al.,
2018). This classification method is also applied in this study. As shown in Figure 2, air was
jetted out from the ventilation duct rapidly, forming a high-velocity strip airflow field extending to the heading face, and then the airflow flowed against the heading face to the other side
and turned back towards the roadway exit. The region between the heading face and ventilation duct was regarded as the vortex region. In this region, the airflow slowed down quickly
with ventilation velocity decreasing from 15.33 m/s to about 3.5 m/s due to energy loss. Afterwards, air flowed into the multi-direction turbulence region with a length of about 16.0 m,
Figure 2. Velocity field of airflow in the roadway.
Figure 3. Velocity field sections of airflow in the roadway.
Vortex region
Multi-direction turbulence
region
10.000 (m)
Stable region
Velocity I m ·s·1
0.00 3.86 7.72 11.59 15.45