

554
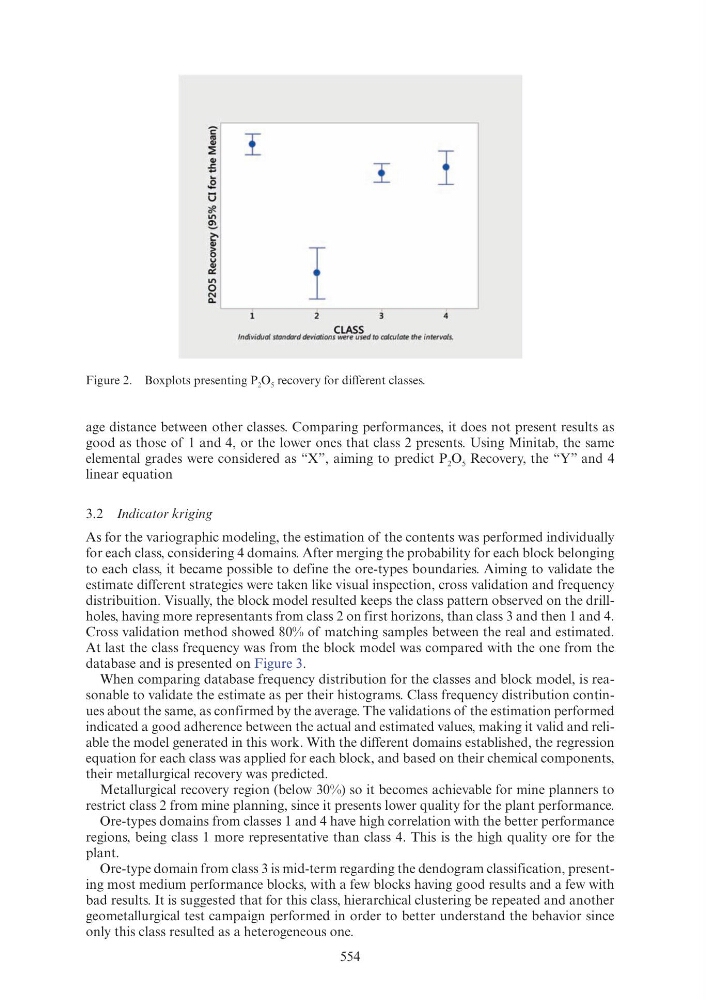
age distance between other classes. Comparing performances, it does not present results as
good as those of 1 and 4, or the lower ones that class 2 presents. Using Minitab, the same
elemental grades were considered as “X”, aiming to predict P 2 O 5 Recovery, the “Y” and 4
linear equation
3.2 Indicator kriging
As for the variographic modeling, the estimation of the contents was performed individually
for each class, considering 4 domains. After merging the probability for each block belonging
to each class, it became possible to define the ore-types boundaries. Aiming to validate the
estimate different strategies were taken like visual inspection, cross validation and frequency
distribuition. Visually, the block model resulted keeps the class pattern observed on the drillholes, having more representants from class 2 on first horizons, than class 3 and then 1 and 4.
Cross validation method showed 80% of matching samples between the real and estimated.
At last the class frequency was from the block model was compared with the one from the
database and is presented on Figure 3.
When comparing database frequency distribution for the classes and block model, is reasonable to validate the estimate as per their histograms. Class frequency distribution continues about the same, as confirmed by the average. The validations of the estimation performed
indicated a good adherence between the actual and estimated values, making it valid and reliable the model generated in this work. With the different domains established, the regression
equation for each class was applied for each block, and based on their chemical components,
their metallurgical recovery was predicted.
Metallurgical recovery region (below 30%) so it becomes achievable for mine planners to
restrict class 2 from mine planning, since it presents lower quality for the plant performance.
Ore-types domains from classes 1 and 4 have high correlation with the better performance
regions, being class 1 more representative than class 4. This is the high quality ore for the
plant.
Ore-type domain from class 3 is mid-term regarding the dendogram classification, presenting most medium performance blocks, with a few blocks having good results and a few with
bad results. It is suggested that for this class, hierarchical clustering be repeated and another
geometallurgical test campaign performed in order to better understand the behavior since
only this class resulted as a heterogeneous one.
Figure 2. Boxplots presenting P 2 O 5 recovery for different classes.
I
I
I
4
CLASS
Individual standard deviations were used to calculate the intervals.