

555
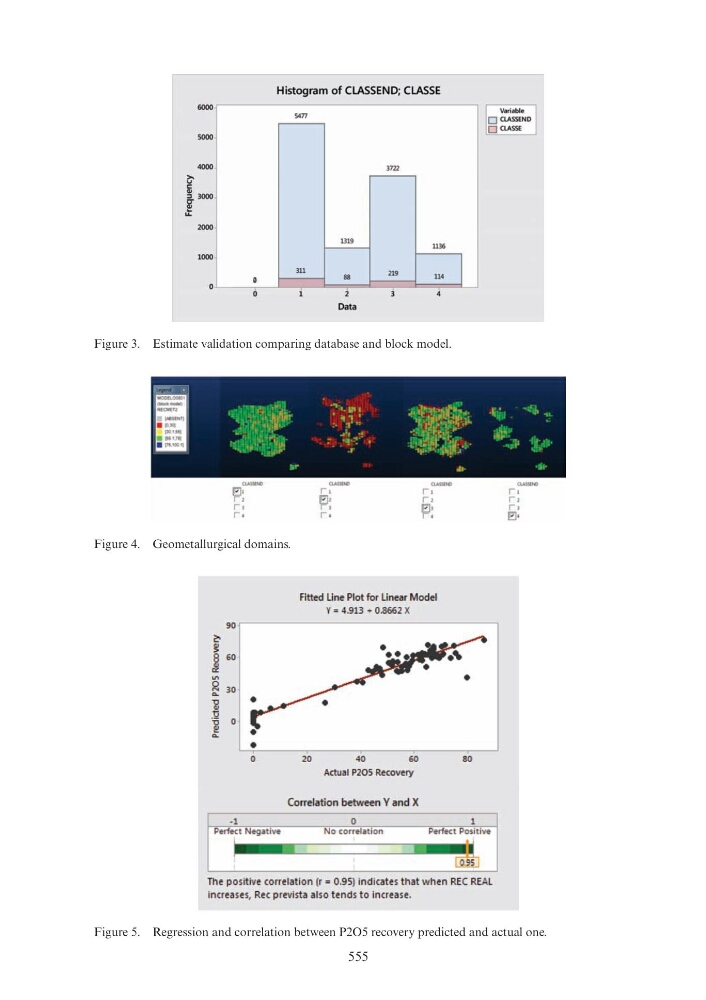
Figure 3. Estimate validation comparing database and block model.
Figure 4. Geometallurgical domains.
Figure 5. Regression and correlation between P2O5 recovery predicted and actual one.
>.
v
6000
sooo
4000
~ 3000
....
2000
1000
~
!t:
8
&!
~
2
~
-o OJ
.il
-o
~
~
G
'''"""
IEJ• ,, ,,
••
90
50
30
0
-1
•
0
Histogram of CLASSEND; CLASSE
5477
3722
1319
1136
311
219
88
114
Dat a
Fitted Line Plot for Linear Model
Y = 4 .913 + 0 .866 2 X
20
40
50
Actual P205 Recov ery
Correla~ion between Y a.nd X
0
I
No correlat ion
Perfect f>O!I~ t ive
II
CQID
Th e po sit ive correlatio n (r = 0 .95) ind icates t h at w he n REC REAL
incre·ases, Re c p revista also te nd s to increase.
'""""'
,, ,, ,,
IEJ•