

487
data were provided by OPC servers but could not be accessed or integrated with other data
sources. Operational data were collected manually.
In the mine, cleaning operations are performed in the conditions where basement of the
coal face is not cut properly or rocks from the hanging wall fall off the longwall face. In the
model, it is assumed that there is no coal production during the cleaning operations. In addition, top coal production in the model is performed after shields are moved forward. In the
model, time between arrivals and duration of the shearer delays are randomly assigned based
on the collected data and the statistical distributions that were fit by using Arena
® Input Analyzer. In the model, all the shearer stoppages have been defined as delays irrespective of their
causes. Similar to the determination of time between arrivals and duration of the shearer
delays, cleaning operation, shearer movement, shield advance, conveyor operations, and top
coal production processes were also individually modelled to build up the simulation model
that represents the coal production for the LTCC operation. The statistical distributions used
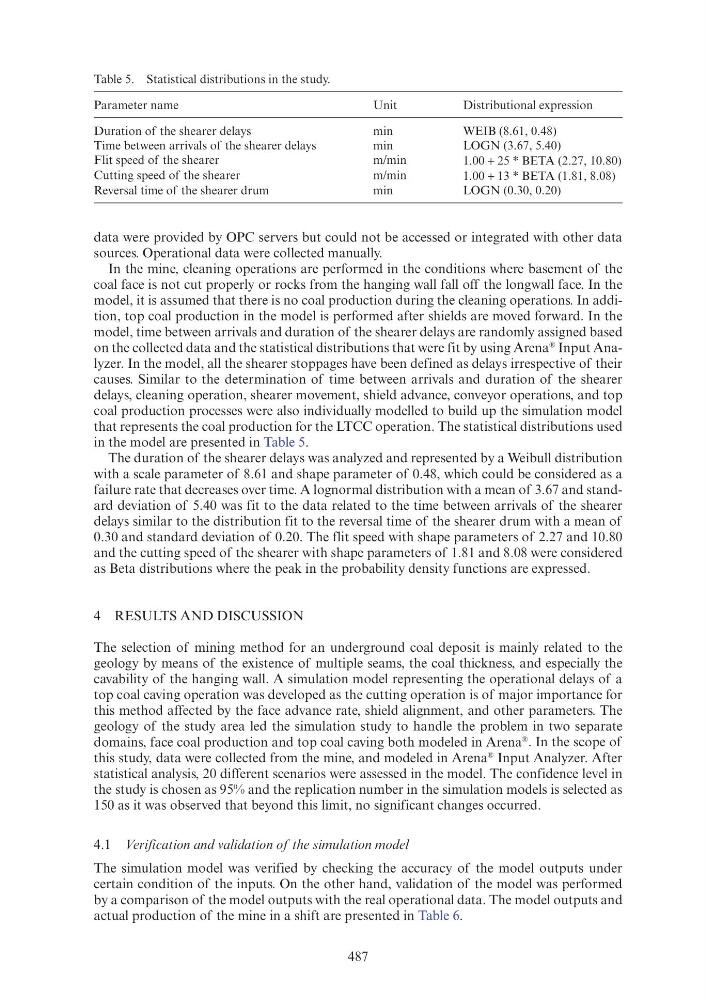
in the model are presented in Table 5.
The duration of the shearer delays was analyzed and represented by a Weibull distribution
with a scale parameter of 8.61 and shape parameter of 0.48, which could be considered as a
failure rate that decreases over time. A lognormal distribution with a mean of 3.67 and standard deviation of 5.40 was fit to the data related to the time between arrivals of the shearer
delays similar to the distribution fit to the reversal time of the shearer drum with a mean of
0.30 and standard deviation of 0.20. The flit speed with shape parameters of 2.27 and 10.80
and the cutting speed of the shearer with shape parameters of 1.81 and 8.08 were considered
as Beta distributions where the peak in the probability density functions are expressed.
4 RESULTS AND DISCUSSION
The selection of mining method for an underground coal deposit is mainly related to the
geology by means of the existence of multiple seams, the coal thickness, and especially the
cavability of the hanging wall. A simulation model representing the operational delays of a
top coal caving operation was developed as the cutting operation is of major importance for
this method affected by the face advance rate, shield alignment, and other parameters. The
geology of the study area led the simulation study to handle the problem in two separate
domains, face coal production and top coal caving both modeled in Arena
®
. In the scope of
this study, data were collected from the mine, and modeled in Arena
® Input Analyzer. After
statistical analysis, 20 different scenarios were assessed in the model. The confidence level in
the study is chosen as 95% and the replication number in the simulation models is selected as
150 as it was observed that beyond this limit, no significant changes occurred.
4.1 Verification and validation of the simulation model
The simulation model was verified by checking the accuracy of the model outputs under
certain condition of the inputs. On the other hand, validation of the model was performed
by a comparison of the model outputs with the real operational data. The model outputs and
actual production of the mine in a shift are presented in Table 6.
Table 5. Statistical distributions in the study.
Parameter name
Unit
Distributional expression
Duration of the shearer delays
min
WEIB (8.61, 0.48)
Time between arrivals of the shearer delays
min
LOGN (3.67, 5.40)
Flit speed of the shearer
m/min
1.00 + 25 * BETA (2.27, 10.80)
Cutting speed of the shearer
m/min
1.00 + 13 * BETA (1.81, 8.08)
Reversal time of the shearer drum
min
LOGN (0.30, 0.20)
data were provided by OPC servers but could not be accessed or integrated with other data
sources. Operational data were collected manually.
In the mine, cleaning operations are performed in the conditions where basement of the
coal face is not cut properly or rocks from the hanging wall fall off the longwall face. In the
model, it is assumed that there is no coal production during the cleaning operations. In addition, top coal production in the model is performed after shields are moved forward. In the
model, time between arrivals and duration of the shearer delays are randomly assigned based
on the collected data and the statistical distributions that were fit by using Arena
® Input Analyzer. In the model, all the shearer stoppages have been defined as delays irrespective of their
causes. Similar to the determination of time between arrivals and duration of the shearer
delays, cleaning operation, shearer movement, shield advance, conveyor operations, and top
coal production processes were also individually modelled to build up the simulation model
that represents the coal production for the LTCC operation. The statistical distributions used
in the model are presented in Table 5.
The duration of the shearer delays was analyzed and represented by a Weibull distribution
with a scale parameter of 8.61 and shape parameter of 0.48, which could be considered as a
failure rate that decreases over time. A lognormal distribution with a mean of 3.67 and standard deviation of 5.40 was fit to the data related to the time between arrivals of the shearer
delays similar to the distribution fit to the reversal time of the shearer drum with a mean of
0.30 and standard deviation of 0.20. The flit speed with shape parameters of 2.27 and 10.80
and the cutting speed of the shearer with shape parameters of 1.81 and 8.08 were considered
as Beta distributions where the peak in the probability density functions are expressed.
4 RESULTS AND DISCUSSION
The selection of mining method for an underground coal deposit is mainly related to the
geology by means of the existence of multiple seams, the coal thickness, and especially the
cavability of the hanging wall. A simulation model representing the operational delays of a
top coal caving operation was developed as the cutting operation is of major importance for
this method affected by the face advance rate, shield alignment, and other parameters. The
geology of the study area led the simulation study to handle the problem in two separate
domains, face coal production and top coal caving both modeled in Arena
®
. In the scope of
this study, data were collected from the mine, and modeled in Arena
® Input Analyzer. After
statistical analysis, 20 different scenarios were assessed in the model. The confidence level in
the study is chosen as 95% and the replication number in the simulation models is selected as
150 as it was observed that beyond this limit, no significant changes occurred.
4.1 Verification and validation of the simulation model
The simulation model was verified by checking the accuracy of the model outputs under
certain condition of the inputs. On the other hand, validation of the model was performed
by a comparison of the model outputs with the real operational data. The model outputs and
actual production of the mine in a shift are presented in Table 6.
Table 5. Statistical distributions in the study.
Parameter name
Unit
Distributional expression
Duration of the shearer delays
min
WEIB (8.61, 0.48)
Time between arrivals of the shearer delays
min
LOGN (3.67, 5.40)
Flit speed of the shearer
m/min
1.00 + 25 * BETA (2.27, 10.80)
Cutting speed of the shearer
m/min
1.00 + 13 * BETA (1.81, 8.08)
Reversal time of the shearer drum
min
LOGN (0.30, 0.20)