

488
As it can be seen in Table 6, the outputs of the simulation model are compatible with the
results of the real operational data. After validation processes were completed, alternatives
were tested in the same simulation model.
4.2 Evaluations and results of the simulation model
Model outputs show that the face coal production was 228.15 tonnes per shift, top coal
production was 2984.43 tonnes per shift, and as a result, total production in the mine was
3212.58 tonnes per shift. In the context of this study, sensitivity analysis on face coal production was performed to investigate shearer performance. Distributional parameters of the
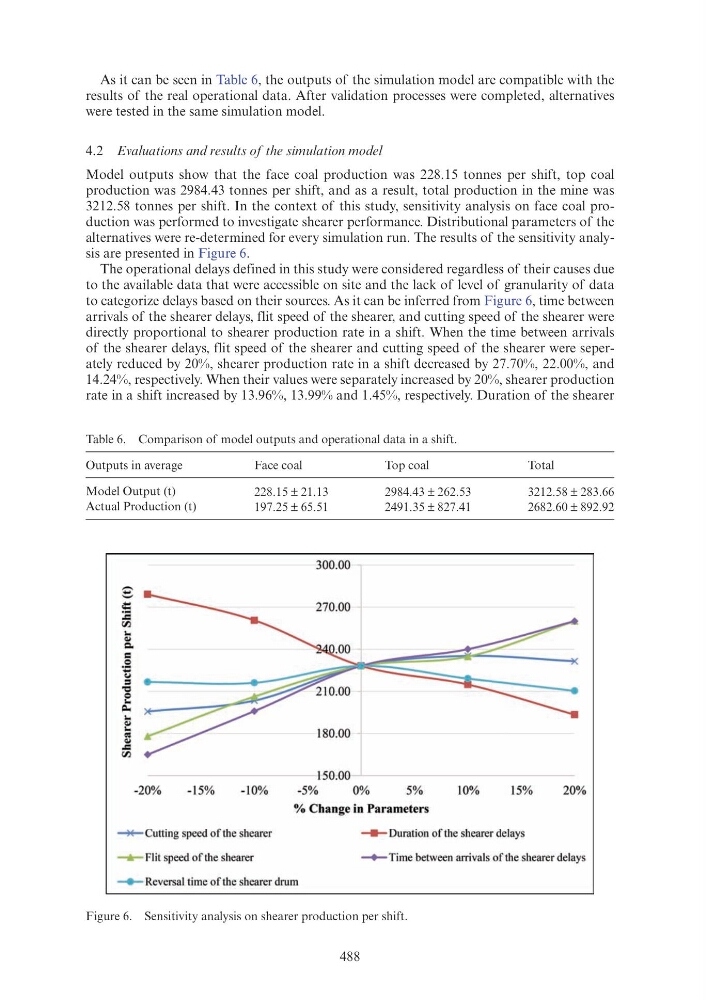
alternatives were re-determined for every simulation run. The results of the sensitivity analysis are presented in Figure 6.
The operational delays defined in this study were considered regardless of their causes due
to the available data that were accessible on site and the lack of level of granularity of data
to categorize delays based on their sources. As it can be inferred from Figure 6, time between
arrivals of the shearer delays, flit speed of the shearer, and cutting speed of the shearer were
directly proportional to shearer production rate in a shift. When the time between arrivals
of the shearer delays, flit speed of the shearer and cutting speed of the shearer were seperately reduced by 20%, shearer production rate in a shift decreased by 27.70%, 22.00%, and
14.24%, respectively. When their values were separately increased by 20%, shearer production
rate in a shift increased by 13.96%, 13.99% and 1.45%, respectively. Duration of the shearer
Table 6. Comparison of model outputs and operational data in a shift.
Outputs in average
Face coal
Top coal
Total
Model Output (t)
228.15 ± 21.13
2984.43 ± 262.53
3212.58 ± 283.66
Actual Production (t)
197.25 ± 65.51
2491.35 ± 827.41
2682.60 ± 892.92
Figure 6. Sensitivity analysis on shearer production per shift.
,-..,
;::,
;;::
:: rJJ ..
.,
Q.
=
.Si .....
'-'
=
"C
0
..
~
..
., ..
~
.,
-= rJJ
-20%
-15%
-10%
~ Cutti ng speed of the shearer
_...,.._ Flit speed of the shearer
300.00
150.00
-5%
0%
5%
% Change in Parameters
10%
15%
-
Duration of the shearer delays
20%
--+-- Time between arrivals of the shearer delays
--+-Reversal time of the shearer drum
As it can be seen in Table 6, the outputs of the simulation model are compatible with the
results of the real operational data. After validation processes were completed, alternatives
were tested in the same simulation model.
4.2 Evaluations and results of the simulation model
Model outputs show that the face coal production was 228.15 tonnes per shift, top coal
production was 2984.43 tonnes per shift, and as a result, total production in the mine was
3212.58 tonnes per shift. In the context of this study, sensitivity analysis on face coal production was performed to investigate shearer performance. Distributional parameters of the
alternatives were re-determined for every simulation run. The results of the sensitivity analysis are presented in Figure 6.
The operational delays defined in this study were considered regardless of their causes due
to the available data that were accessible on site and the lack of level of granularity of data
to categorize delays based on their sources. As it can be inferred from Figure 6, time between
arrivals of the shearer delays, flit speed of the shearer, and cutting speed of the shearer were
directly proportional to shearer production rate in a shift. When the time between arrivals
of the shearer delays, flit speed of the shearer and cutting speed of the shearer were seperately reduced by 20%, shearer production rate in a shift decreased by 27.70%, 22.00%, and
14.24%, respectively. When their values were separately increased by 20%, shearer production
rate in a shift increased by 13.96%, 13.99% and 1.45%, respectively. Duration of the shearer
Table 6. Comparison of model outputs and operational data in a shift.
Outputs in average
Face coal
Top coal
Total
Model Output (t)
228.15 ± 21.13
2984.43 ± 262.53
3212.58 ± 283.66
Actual Production (t)
197.25 ± 65.51
2491.35 ± 827.41
2682.60 ± 892.92
Figure 6. Sensitivity analysis on shearer production per shift.
,-..,
;::,
;;::
:: rJJ ..
.,
Q.
=
.Si .....
'-'
=
"C
0
..
~
..
., ..
~
.,
-= rJJ
-20%
-15%
-10%
~ Cutti ng speed of the shearer
_...,.._ Flit speed of the shearer
300.00
150.00
-5%
0%
5%
% Change in Parameters
10%
15%
-
Duration of the shearer delays
20%
--+-- Time between arrivals of the shearer delays
--+-Reversal time of the shearer drum