

470
To identify which set of parameters generate the best forecasts for mass and metallurgical
recovery in all plant outputs, it was tested several combinations, as described below.
The first step is to define which is the best learning rate to be used in the backpropagation
algorithm (details in Izenman (2008)). It was tested values between 10
−6 and 10
−1 and for 0.05
best results were obtained.
The activation functions tested in the hidden layer were: linear, sigmoid, hyperbolic tangent, relu and softplus; being the sigmoid function (equation 17) the one that presented the
best results. For the activation function in the output layer no tests were realized, once it is
necessary to have an output inside the real numbers set, what can be achieved only using the
linear function (equation 18).
The test for hidden nodes number was realized considering networks with 2 to 15 nodes.
The 14 nodes network gave the best results.
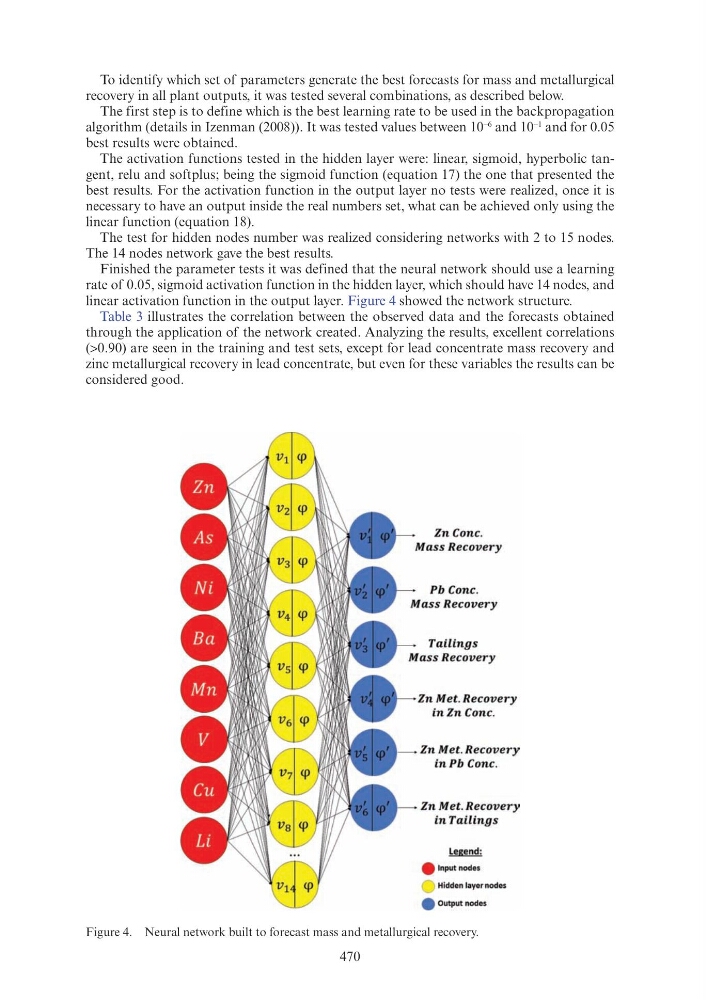
Finished the parameter tests it was defined that the neural network should use a learning
rate of 0.05, sigmoid activation function in the hidden layer, which should have 14 nodes, and
linear activation function in the output layer. Figure 4 showed the network structure.
Table 3 illustrates the correlation between the observed data and the forecasts obtained
through the application of the network created. Analyzing the results, excellent correlations
(>0.90) are seen in the training and test sets, except for lead concentrate mass recovery and
zinc metallurgical recovery in lead concentrate, but even for these variables the results can be
considered good.
Figure 4. Neural network built to forecast mass and metallurgical recovery.
Zn Cone.
Pb Cone.
Tailings
Mass Recovery
Zn Met. Recov ery
inZn Cone.
Zn Met . Recovery
inPb Cone.
Zn Met. Recovery
in Tailings
Legend:
e Input nodes
Hidden layer nodes
4l Output nodes
To identify which set of parameters generate the best forecasts for mass and metallurgical
recovery in all plant outputs, it was tested several combinations, as described below.
The first step is to define which is the best learning rate to be used in the backpropagation
algorithm (details in Izenman (2008)). It was tested values between 10
−6 and 10
−1 and for 0.05
best results were obtained.
The activation functions tested in the hidden layer were: linear, sigmoid, hyperbolic tangent, relu and softplus; being the sigmoid function (equation 17) the one that presented the
best results. For the activation function in the output layer no tests were realized, once it is
necessary to have an output inside the real numbers set, what can be achieved only using the
linear function (equation 18).
The test for hidden nodes number was realized considering networks with 2 to 15 nodes.
The 14 nodes network gave the best results.
Finished the parameter tests it was defined that the neural network should use a learning
rate of 0.05, sigmoid activation function in the hidden layer, which should have 14 nodes, and
linear activation function in the output layer. Figure 4 showed the network structure.
Table 3 illustrates the correlation between the observed data and the forecasts obtained
through the application of the network created. Analyzing the results, excellent correlations
(>0.90) are seen in the training and test sets, except for lead concentrate mass recovery and
zinc metallurgical recovery in lead concentrate, but even for these variables the results can be
considered good.
Figure 4. Neural network built to forecast mass and metallurgical recovery.
Zn Cone.
Pb Cone.
Tailings
Mass Recovery
Zn Met. Recov ery
inZn Cone.
Zn Met . Recovery
inPb Cone.
Zn Met. Recovery
in Tailings
Legend:
e Input nodes
Hidden layer nodes
4l Output nodes