

430
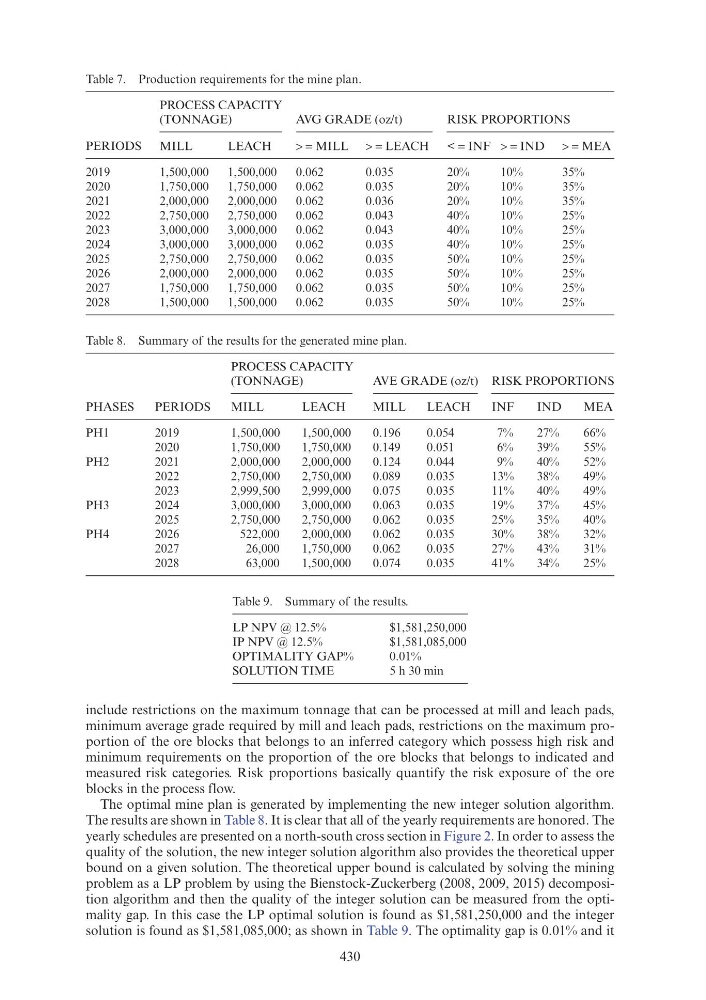
include restrictions on the maximum tonnage that can be processed at mill and leach pads,
minimum average grade required by mill and leach pads, restrictions on the maximum proportion of the ore blocks that belongs to an inferred category which possess high risk and
minimum requirements on the proportion of the ore blocks that belongs to indicated and
measured risk categories. Risk proportions basically quantify the risk exposure of the ore
blocks in the process flow.
The optimal mine plan is generated by implementing the new integer solution algorithm.
The results are shown in Table 8. It is clear that all of the yearly requirements are honored. The
yearly schedules are presented on a north-south cross section in Figure 2. In order to assess the
quality of the solution, the new integer solution algorithm also provides the theoretical upper
bound on a given solution. The theoretical upper bound is calculated by solving the mining
problem as a LP problem by using the Bienstock-Zuckerberg (2008, 2009, 2015) decomposition algorithm and then the quality of the integer solution can be measured from the optimality gap. In this case the LP optimal solution is found as $1,581,250,000 and the integer
solution is found as $1,581,085,000; as shown in Table 9. The optimality gap is 0.01% and it
Table 7. Production requirements for the mine plan.
PERIODS
PROCESS CAPACITY
(TONNAGE)
AVG GRADE (oz/t)
RISK PROPORTIONS
MILL
LEACH
> = MILL > = LEACH < = INF > = IND > = MEA
2019
1,500,000
1,500,000
0.062
0.035
20%
10%
35%
2020
1,750,000
1,750,000
0.062
0.035
20%
10%
35%
2021
2,000,000
2,000,000
0.062
0.036
20%
10%
35%
2022
2,750,000
2,750,000
0.062
0.043
40%
10%
25%
2023
3,000,000
3,000,000
0.062
0.043
40%
10%
25%
2024
3,000,000
3,000,000
0.062
0.035
40%
10%
25%
2025
2,750,000
2,750,000
0.062
0.035
50%
10%
25%
2026
2,000,000
2,000,000
0.062
0.035
50%
10%
25%
2027
1,750,000
1,750,000
0.062
0.035
50%
10%
25%
2028
1,500,000
1,500,000
0.062
0.035
50%
10%
25%
Table 8. Summary of the results for the generated mine plan.
PHASES
PERIODS
PROCESS CAPACITY
(TONNAGE)
AVE GRADE (oz/t) RISK PROPORTIONS
MILL
LEACH
MILL
LEACH
INF
IND
MEA
PH1
2019
1,500,000
1,500,000
0.196
0.054
7%
27%
66%
2020
1,750,000
1,750,000
0.149
0.051
6%
39%
55%
PH2
2021
2,000,000
2,000,000
0.124
0.044
9%
40%
52%
2022
2,750,000
2,750,000
0.089
0.035
13%
38%
49%
2023
2,999,500
2,999,000
0.075
0.035
11%
40%
49%
PH3
2024
3,000,000
3,000,000
0.063
0.035
19%
37%
45%
2025
2,750,000
2,750,000
0.062
0.035
25%
35%
40%
PH4
2026
522,000
2,000,000
0.062
0.035
30%
38%
32%
2027
26,000
1,750,000
0.062
0.035
27%
43%
31%
2028
63,000
1,500,000
0.074
0.035
41%
34%
25%
Table 9. Summary of the results.
LP NPV @ 12.5%
$1,581,250,000
IP NPV @ 12.5%
$1,581,085,000
OPTIMALITY GAP%
0.01%
SOLUTION TIME
5 h 30 min
include restrictions on the maximum tonnage that can be processed at mill and leach pads,
minimum average grade required by mill and leach pads, restrictions on the maximum proportion of the ore blocks that belongs to an inferred category which possess high risk and
minimum requirements on the proportion of the ore blocks that belongs to indicated and
measured risk categories. Risk proportions basically quantify the risk exposure of the ore
blocks in the process flow.
The optimal mine plan is generated by implementing the new integer solution algorithm.
The results are shown in Table 8. It is clear that all of the yearly requirements are honored. The
yearly schedules are presented on a north-south cross section in Figure 2. In order to assess the
quality of the solution, the new integer solution algorithm also provides the theoretical upper
bound on a given solution. The theoretical upper bound is calculated by solving the mining
problem as a LP problem by using the Bienstock-Zuckerberg (2008, 2009, 2015) decomposition algorithm and then the quality of the integer solution can be measured from the optimality gap. In this case the LP optimal solution is found as $1,581,250,000 and the integer
solution is found as $1,581,085,000; as shown in Table 9. The optimality gap is 0.01% and it
Table 7. Production requirements for the mine plan.
PERIODS
PROCESS CAPACITY
(TONNAGE)
AVG GRADE (oz/t)
RISK PROPORTIONS
MILL
LEACH
> = MILL > = LEACH < = INF > = IND > = MEA
2019
1,500,000
1,500,000
0.062
0.035
20%
10%
35%
2020
1,750,000
1,750,000
0.062
0.035
20%
10%
35%
2021
2,000,000
2,000,000
0.062
0.036
20%
10%
35%
2022
2,750,000
2,750,000
0.062
0.043
40%
10%
25%
2023
3,000,000
3,000,000
0.062
0.043
40%
10%
25%
2024
3,000,000
3,000,000
0.062
0.035
40%
10%
25%
2025
2,750,000
2,750,000
0.062
0.035
50%
10%
25%
2026
2,000,000
2,000,000
0.062
0.035
50%
10%
25%
2027
1,750,000
1,750,000
0.062
0.035
50%
10%
25%
2028
1,500,000
1,500,000
0.062
0.035
50%
10%
25%
Table 8. Summary of the results for the generated mine plan.
PHASES
PERIODS
PROCESS CAPACITY
(TONNAGE)
AVE GRADE (oz/t) RISK PROPORTIONS
MILL
LEACH
MILL
LEACH
INF
IND
MEA
PH1
2019
1,500,000
1,500,000
0.196
0.054
7%
27%
66%
2020
1,750,000
1,750,000
0.149
0.051
6%
39%
55%
PH2
2021
2,000,000
2,000,000
0.124
0.044
9%
40%
52%
2022
2,750,000
2,750,000
0.089
0.035
13%
38%
49%
2023
2,999,500
2,999,000
0.075
0.035
11%
40%
49%
PH3
2024
3,000,000
3,000,000
0.063
0.035
19%
37%
45%
2025
2,750,000
2,750,000
0.062
0.035
25%
35%
40%
PH4
2026
522,000
2,000,000
0.062
0.035
30%
38%
32%
2027
26,000
1,750,000
0.062
0.035
27%
43%
31%
2028
63,000
1,500,000
0.074
0.035
41%
34%
25%
Table 9. Summary of the results.
LP NPV @ 12.5%
$1,581,250,000
IP NPV @ 12.5%
$1,581,085,000
OPTIMALITY GAP%
0.01%
SOLUTION TIME
5 h 30 min