

431
took 5 hours 30 minutes to achieve an integer solution. Such a small optimality gap has never
been reported in the literature on a problem of this size (∼7.3 million variables) with capacity
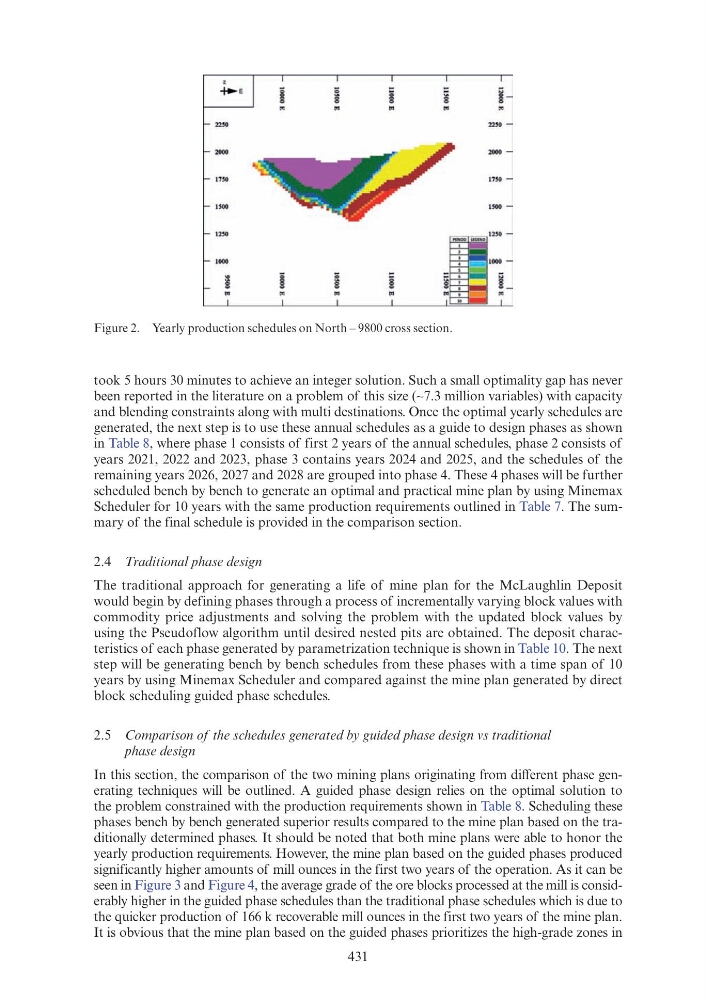
and blending constraints along with multi destinations. Once the optimal yearly schedules are
generated, the next step is to use these annual schedules as a guide to design phases as shown
in Table 8, where phase 1 consists of first 2 years of the annual schedules, phase 2 consists of
years 2021, 2022 and 2023, phase 3 contains years 2024 and 2025, and the schedules of the
remaining years 2026, 2027 and 2028 are grouped into phase 4. These 4 phases will be further
scheduled bench by bench to generate an optimal and practical mine plan by using Minemax
Scheduler for 10 years with the same production requirements outlined in Table 7. The summary of the final schedule is provided in the comparison section.
2.4 Traditional phase design
The traditional approach for generating a life of mine plan for the McLaughlin Deposit
would begin by defining phases through a process of incrementally varying block values with
commodity price adjustments and solving the problem with the updated block values by
using the Pseudoflow algorithm until desired nested pits are obtained. The deposit characteristics of each phase generated by parametrization technique is shown in Table 10. The next
step will be generating bench by bench schedules from these phases with a time span of 10
years by using Minemax Scheduler and compared against the mine plan generated by direct
block scheduling guided phase schedules.
2.5 Comparison of the schedules generated by guided phase design vs traditional
phase design
In this section, the comparison of the two mining plans originating from different phase generating techniques will be outlined. A guided phase design relies on the optimal solution to
the problem constrained with the production requirements shown in Table 8. Scheduling these
phases bench by bench generated superior results compared to the mine plan based on the traditionally determined phases. It should be noted that both mine plans were able to honor the
yearly production requirements. However, the mine plan based on the guided phases produced
significantly higher amounts of mill ounces in the first two years of the operation. As it can be
seen in Figure 3 and Figure 4, the average grade of the ore blocks processed at the mill is considerably higher in the guided phase schedules than the traditional phase schedules which is due to
the quicker production of 166 k recoverable mill ounces in the first two years of the mine plan.
It is obvious that the mine plan based on the guided phases prioritizes the high-grade zones in
Figure 2. Yearly production schedules on North – 9800 cross section.
took 5 hours 30 minutes to achieve an integer solution. Such a small optimality gap has never
been reported in the literature on a problem of this size (∼7.3 million variables) with capacity
and blending constraints along with multi destinations. Once the optimal yearly schedules are
generated, the next step is to use these annual schedules as a guide to design phases as shown
in Table 8, where phase 1 consists of first 2 years of the annual schedules, phase 2 consists of
years 2021, 2022 and 2023, phase 3 contains years 2024 and 2025, and the schedules of the
remaining years 2026, 2027 and 2028 are grouped into phase 4. These 4 phases will be further
scheduled bench by bench to generate an optimal and practical mine plan by using Minemax
Scheduler for 10 years with the same production requirements outlined in Table 7. The summary of the final schedule is provided in the comparison section.
2.4 Traditional phase design
The traditional approach for generating a life of mine plan for the McLaughlin Deposit
would begin by defining phases through a process of incrementally varying block values with
commodity price adjustments and solving the problem with the updated block values by
using the Pseudoflow algorithm until desired nested pits are obtained. The deposit characteristics of each phase generated by parametrization technique is shown in Table 10. The next
step will be generating bench by bench schedules from these phases with a time span of 10
years by using Minemax Scheduler and compared against the mine plan generated by direct
block scheduling guided phase schedules.
2.5 Comparison of the schedules generated by guided phase design vs traditional
phase design
In this section, the comparison of the two mining plans originating from different phase generating techniques will be outlined. A guided phase design relies on the optimal solution to
the problem constrained with the production requirements shown in Table 8. Scheduling these
phases bench by bench generated superior results compared to the mine plan based on the traditionally determined phases. It should be noted that both mine plans were able to honor the
yearly production requirements. However, the mine plan based on the guided phases produced
significantly higher amounts of mill ounces in the first two years of the operation. As it can be
seen in Figure 3 and Figure 4, the average grade of the ore blocks processed at the mill is considerably higher in the guided phase schedules than the traditional phase schedules which is due to
the quicker production of 166 k recoverable mill ounces in the first two years of the mine plan.
It is obvious that the mine plan based on the guided phases prioritizes the high-grade zones in
Figure 2. Yearly production schedules on North – 9800 cross section.