

429
0.034 oz/t, and on the remaining half there are 18.1 thousand mill blocks with an average
grade of 0.133 oz/t, and 24.4 thousand undecided blocks with an average grade of 0.057 oz/t.
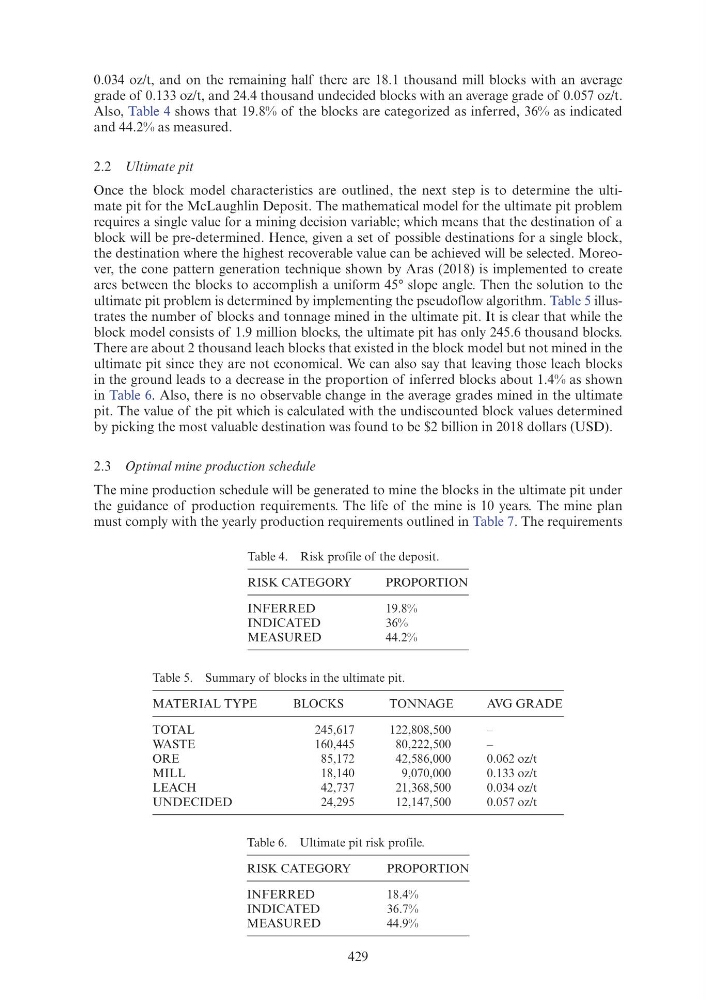
Also, Table 4 shows that 19.8% of the blocks are categorized as inferred, 36% as indicated
and 44.2% as measured.
2.2 Ultimate pit
Once the block model characteristics are outlined, the next step is to determine the ultimate pit for the McLaughlin Deposit. The mathematical model for the ultimate pit problem
requires a single value for a mining decision variable; which means that the destination of a
block will be pre-determined. Hence, given a set of possible destinations for a single block,
the destination where the highest recoverable value can be achieved will be selected. Moreover, the cone pattern generation technique shown by Aras (2018) is implemented to create
arcs between the blocks to accomplish a uniform 45° slope angle. Then the solution to the
ultimate pit problem is determined by implementing the pseudoflow algorithm. Table 5 illustrates the number of blocks and tonnage mined in the ultimate pit. It is clear that while the
block model consists of 1.9 million blocks, the ultimate pit has only 245.6 thousand blocks.
There are about 2 thousand leach blocks that existed in the block model but not mined in the
ultimate pit since they are not economical. We can also say that leaving those leach blocks
in the ground leads to a decrease in the proportion of inferred blocks about 1.4% as shown
in Table 6. Also, there is no observable change in the average grades mined in the ultimate
pit. The value of the pit which is calculated with the undiscounted block values determined
by picking the most valuable destination was found to be $2 billion in 2018 dollars (USD).
2.3 Optimal mine production schedule
The mine production schedule will be generated to mine the blocks in the ultimate pit under
the guidance of production requirements. The life of the mine is 10 years. The mine plan
must comply with the yearly production requirements outlined in Table 7. The requirements
Table 4. Risk profile of the deposit.
RISK CATEGORY
PROPORTION
INFERRED
19.8%
INDICATED
36%
MEASURED
44.2%
Table 5. Summary of blocks in the ultimate pit.
MATERIAL TYPE
BLOCKS
TONNAGE
AVG GRADE
TOTAL
245,617
122,808,500
–
WASTE
160,445
80,222,500
–
ORE
85,172
42,586,000
0.062 oz/t
MILL
18,140
9,070,000
0.133 oz/t
LEACH
42,737
21,368,500
0.034 oz/t
UNDECIDED
24,295
12,147,500
0.057 oz/t
Table 6. Ultimate pit risk profile.
RISK CATEGORY
PROPORTION
INFERRED
18.4%
INDICATED
36.7%
MEASURED
44.9%
0.034 oz/t, and on the remaining half there are 18.1 thousand mill blocks with an average
grade of 0.133 oz/t, and 24.4 thousand undecided blocks with an average grade of 0.057 oz/t.
Also, Table 4 shows that 19.8% of the blocks are categorized as inferred, 36% as indicated
and 44.2% as measured.
2.2 Ultimate pit
Once the block model characteristics are outlined, the next step is to determine the ultimate pit for the McLaughlin Deposit. The mathematical model for the ultimate pit problem
requires a single value for a mining decision variable; which means that the destination of a
block will be pre-determined. Hence, given a set of possible destinations for a single block,
the destination where the highest recoverable value can be achieved will be selected. Moreover, the cone pattern generation technique shown by Aras (2018) is implemented to create
arcs between the blocks to accomplish a uniform 45° slope angle. Then the solution to the
ultimate pit problem is determined by implementing the pseudoflow algorithm. Table 5 illustrates the number of blocks and tonnage mined in the ultimate pit. It is clear that while the
block model consists of 1.9 million blocks, the ultimate pit has only 245.6 thousand blocks.
There are about 2 thousand leach blocks that existed in the block model but not mined in the
ultimate pit since they are not economical. We can also say that leaving those leach blocks
in the ground leads to a decrease in the proportion of inferred blocks about 1.4% as shown
in Table 6. Also, there is no observable change in the average grades mined in the ultimate
pit. The value of the pit which is calculated with the undiscounted block values determined
by picking the most valuable destination was found to be $2 billion in 2018 dollars (USD).
2.3 Optimal mine production schedule
The mine production schedule will be generated to mine the blocks in the ultimate pit under
the guidance of production requirements. The life of the mine is 10 years. The mine plan
must comply with the yearly production requirements outlined in Table 7. The requirements
Table 4. Risk profile of the deposit.
RISK CATEGORY
PROPORTION
INFERRED
19.8%
INDICATED
36%
MEASURED
44.2%
Table 5. Summary of blocks in the ultimate pit.
MATERIAL TYPE
BLOCKS
TONNAGE
AVG GRADE
TOTAL
245,617
122,808,500
–
WASTE
160,445
80,222,500
–
ORE
85,172
42,586,000
0.062 oz/t
MILL
18,140
9,070,000
0.133 oz/t
LEACH
42,737
21,368,500
0.034 oz/t
UNDECIDED
24,295
12,147,500
0.057 oz/t
Table 6. Ultimate pit risk profile.
RISK CATEGORY
PROPORTION
INFERRED
18.4%
INDICATED
36.7%
MEASURED
44.9%