

398
running the simulation models, we compared results of implementing the benchmark truck
dispatching model and the MILP truck dispatching model and the results of the comparison
are presented in this section.
We first divided the production measurables into two categories: measurables that are used
to evaluate how the operation meets the production requirement and measurables that are
used to assess the performance of the operation fleet. Table 2 lists the measurable measurables we used to compare our developed MILP truck dispatching model with the in place
truck dispatching model in the case study.
The operation runs with two processing plants with 27600 tons/shift feed requirement for
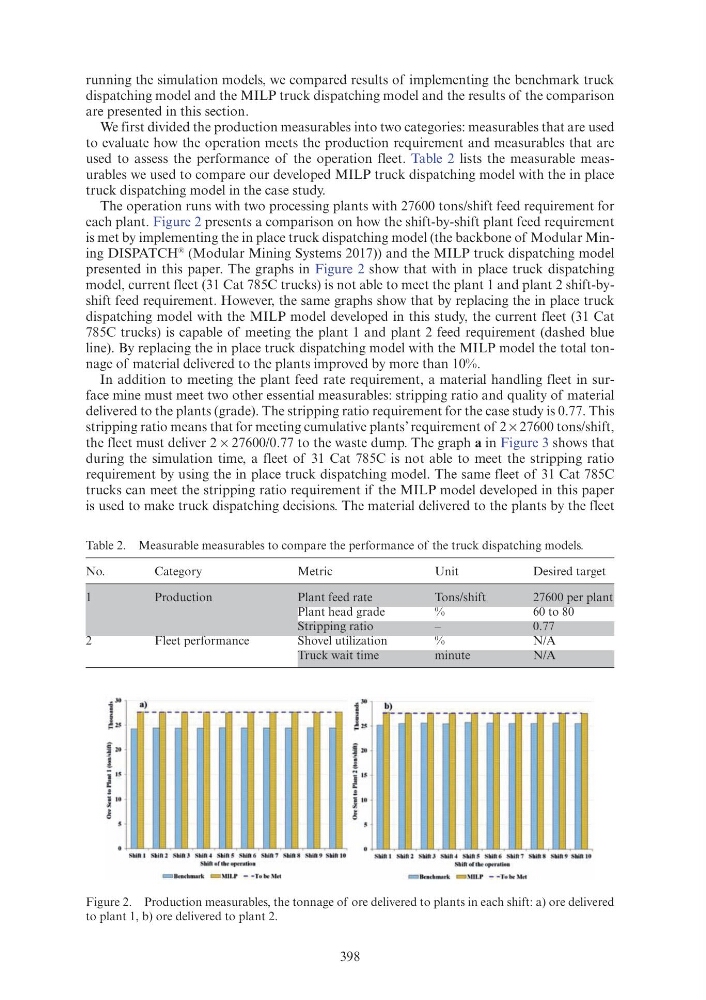
each plant. Figure 2 presents a comparison on how the shift-by-shift plant feed requirement
is met by implementing the in place truck dispatching model (the backbone of Modular Mining DISPATCH
® (Modular Mining Systems 2017)) and the MILP truck dispatching model
presented in this paper. The graphs in Figure 2 show that with in place truck dispatching
model, current fleet (31 Cat 785C trucks) is not able to meet the plant 1 and plant 2 shift-byshift feed requirement. However, the same graphs show that by replacing the in place truck
dispatching model with the MILP model developed in this study, the current fleet (31 Cat
785C trucks) is capable of meeting the plant 1 and plant 2 feed requirement (dashed blue
line). By replacing the in place truck dispatching model with the MILP model the total tonnage of material delivered to the plants improved by more than 10%.
In addition to meeting the plant feed rate requirement, a material handling fleet in surface mine must meet two other essential measurables: stripping ratio and quality of material
delivered to the plants (grade). The stripping ratio requirement for the case study is 0.77. This
stripping ratio means that for meeting cumulative plants’ requirement of 2 × 27600 tons/shift,
the fleet must deliver 2 × 27600/0.77 to the waste dump. The graph a in Figure 3 shows that
during the simulation time, a fleet of 31 Cat 785C is not able to meet the stripping ratio
requirement by using the in place truck dispatching model. The same fleet of 31 Cat 785C
trucks can meet the stripping ratio requirement if the MILP model developed in this paper
is used to make truck dispatching decisions. The material delivered to the plants by the fleet
Table 2. Measurable measurables to compare the performance of the truck dispatching models.
No.
Category
Metric
Unit
Desired target
1
Production
Plant feed rate
Tons/shift
27600 per plant
Plant head grade
%
60 to 80
Stripping ratio
–
0.77
2
Fleet performance
Shovel utilization
%
N/A
Truck wait time
minute
N/A
Figure 2. Production measurables, the tonnage of ore delivered to plants in each shift: a) ore delivered
to plant 1, b) ore delivered to plant 2.
30
"
~20
i
IS
~
s
]
10
'
0
a)
Shift I Shin 2 Shin J Shift 4 Shift 5 Shift 6 Shift 7 ShiR 8 SbiR 9 ShiftlO
Shirl of the Op<>111t iou
30
"
20
IS
10
b)
! -Shift I Shift 2 Shin J Shifi 4 Shift 5 Shift 6 Shift 7 Shift 8 Shift 9 Shift 10
Shiflortheopen lion
~ Benchmark -
r.UL P - - To!)(' M et
running the simulation models, we compared results of implementing the benchmark truck
dispatching model and the MILP truck dispatching model and the results of the comparison
are presented in this section.
We first divided the production measurables into two categories: measurables that are used
to evaluate how the operation meets the production requirement and measurables that are
used to assess the performance of the operation fleet. Table 2 lists the measurable measurables we used to compare our developed MILP truck dispatching model with the in place
truck dispatching model in the case study.
The operation runs with two processing plants with 27600 tons/shift feed requirement for
each plant. Figure 2 presents a comparison on how the shift-by-shift plant feed requirement
is met by implementing the in place truck dispatching model (the backbone of Modular Mining DISPATCH
® (Modular Mining Systems 2017)) and the MILP truck dispatching model
presented in this paper. The graphs in Figure 2 show that with in place truck dispatching
model, current fleet (31 Cat 785C trucks) is not able to meet the plant 1 and plant 2 shift-byshift feed requirement. However, the same graphs show that by replacing the in place truck
dispatching model with the MILP model developed in this study, the current fleet (31 Cat
785C trucks) is capable of meeting the plant 1 and plant 2 feed requirement (dashed blue
line). By replacing the in place truck dispatching model with the MILP model the total tonnage of material delivered to the plants improved by more than 10%.
In addition to meeting the plant feed rate requirement, a material handling fleet in surface mine must meet two other essential measurables: stripping ratio and quality of material
delivered to the plants (grade). The stripping ratio requirement for the case study is 0.77. This
stripping ratio means that for meeting cumulative plants’ requirement of 2 × 27600 tons/shift,
the fleet must deliver 2 × 27600/0.77 to the waste dump. The graph a in Figure 3 shows that
during the simulation time, a fleet of 31 Cat 785C is not able to meet the stripping ratio
requirement by using the in place truck dispatching model. The same fleet of 31 Cat 785C
trucks can meet the stripping ratio requirement if the MILP model developed in this paper
is used to make truck dispatching decisions. The material delivered to the plants by the fleet
Table 2. Measurable measurables to compare the performance of the truck dispatching models.
No.
Category
Metric
Unit
Desired target
1
Production
Plant feed rate
Tons/shift
27600 per plant
Plant head grade
%
60 to 80
Stripping ratio
–
0.77
2
Fleet performance
Shovel utilization
%
N/A
Truck wait time
minute
N/A
Figure 2. Production measurables, the tonnage of ore delivered to plants in each shift: a) ore delivered
to plant 1, b) ore delivered to plant 2.
30
"
~20
i
IS
~
s
]
10
'
0
a)
Shift I Shin 2 Shin J Shift 4 Shift 5 Shift 6 Shift 7 ShiR 8 SbiR 9 ShiftlO
Shirl of the Op<>111t iou
30
"
20
IS
10
b)
! -Shift I Shift 2 Shin J Shifi 4 Shift 5 Shift 6 Shift 7 Shift 8 Shift 9 Shift 10
Shiflortheopen lion
~ Benchmark -
r.UL P - - To!)(' M et