

399
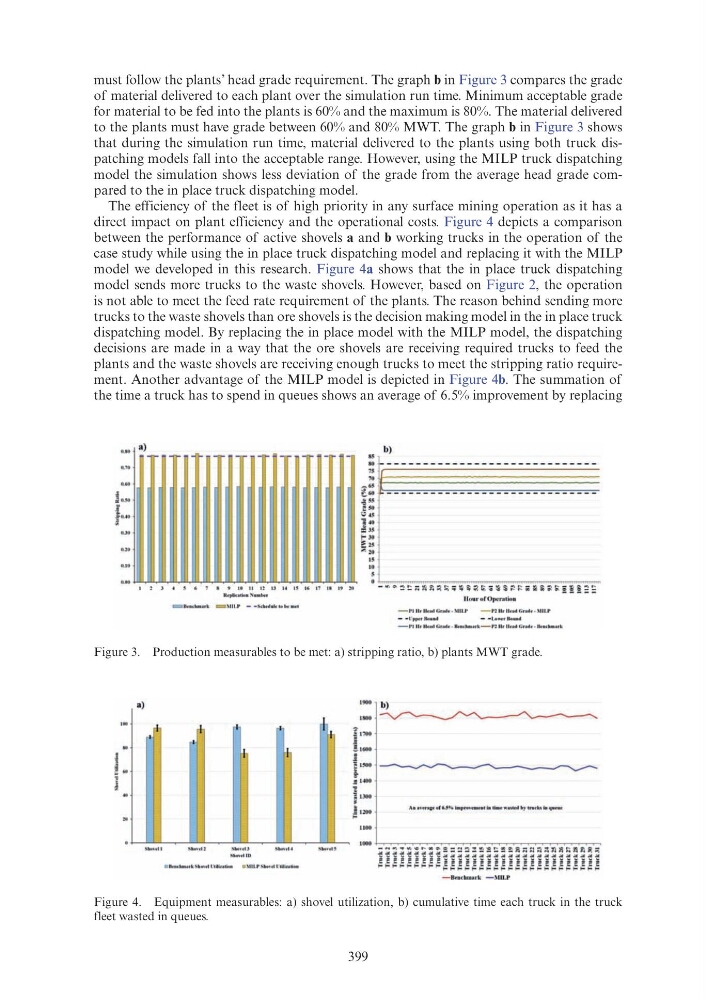
must follow the plants’ head grade requirement. The graph b in Figure 3 compares the grade
of material delivered to each plant over the simulation run time. Minimum acceptable grade
for material to be fed into the plants is 60% and the maximum is 80%. The material delivered
to the plants must have grade between 60% and 80% MWT. The graph b in Figure 3 shows
that during the simulation run time, material delivered to the plants using both truck dispatching models fall into the acceptable range. However, using the MILP truck dispatching
model the simulation shows less deviation of the grade from the average head grade compared to the in place truck dispatching model.
The efficiency of the fleet is of high priority in any surface mining operation as it has a
direct impact on plant efficiency and the operational costs. Figure 4 depicts a comparison
between the performance of active shovels a and b working trucks in the operation of the
case study while using the in place truck dispatching model and replacing it with the MILP
model we developed in this research. Figure 4a shows that the in place truck dispatching
model sends more trucks to the waste shovels. However, based on Figure 2, the operation
is not able to meet the feed rate requirement of the plants. The reason behind sending more
trucks to the waste shovels than ore shovels is the decision making model in the in place truck
dispatching model. By replacing the in place model with the MILP model, the dispatching
decisions are made in a way that the ore shovels are receiving required trucks to feed the
plants and the waste shovels are receiving enough trucks to meet the stripping ratio requirement. Another advantage of the MILP model is depicted in Figure 4b. The summation of
the time a truck has to spend in queues shows an average of 6.5% improvement by replacing
Figure 3. Production measurables to be met: a) stripping ratio, b) plants MWT grade.
Figure 4. Equipment measurables: a) shovel utilization, b) cumulative time each truck in the truck
fleet wasted in queues.
a)
a)
8
9
IQ II 12 1l H
IS
N.~p lintion :o;'am M r
1!!!!11. \ llLI' - • S
"
b)
80
- - - - - - - - - - - - - - - - - - - - - - - - - - - - -
" 70
~:~~~ -~-~- ~ -~- ~ -~-~- ~ -~~~~~~~~~~~~
iJ55
~50
"" ; 40
::Js
i-' 30
Ezs
.... 20
IS
10
1900
1800
1700
1600
1400
!300
1200
1100
b)
I lour oropcution
-
Plllr llud Grado - .\!ILl'
-
r2 U r l l u d Gndr - .\ULI'
- • lli>i>
l'l ll r llndGrodr-8rll
must follow the plants’ head grade requirement. The graph b in Figure 3 compares the grade
of material delivered to each plant over the simulation run time. Minimum acceptable grade
for material to be fed into the plants is 60% and the maximum is 80%. The material delivered
to the plants must have grade between 60% and 80% MWT. The graph b in Figure 3 shows
that during the simulation run time, material delivered to the plants using both truck dispatching models fall into the acceptable range. However, using the MILP truck dispatching
model the simulation shows less deviation of the grade from the average head grade compared to the in place truck dispatching model.
The efficiency of the fleet is of high priority in any surface mining operation as it has a
direct impact on plant efficiency and the operational costs. Figure 4 depicts a comparison
between the performance of active shovels a and b working trucks in the operation of the
case study while using the in place truck dispatching model and replacing it with the MILP
model we developed in this research. Figure 4a shows that the in place truck dispatching
model sends more trucks to the waste shovels. However, based on Figure 2, the operation
is not able to meet the feed rate requirement of the plants. The reason behind sending more
trucks to the waste shovels than ore shovels is the decision making model in the in place truck
dispatching model. By replacing the in place model with the MILP model, the dispatching
decisions are made in a way that the ore shovels are receiving required trucks to feed the
plants and the waste shovels are receiving enough trucks to meet the stripping ratio requirement. Another advantage of the MILP model is depicted in Figure 4b. The summation of
the time a truck has to spend in queues shows an average of 6.5% improvement by replacing
Figure 3. Production measurables to be met: a) stripping ratio, b) plants MWT grade.
Figure 4. Equipment measurables: a) shovel utilization, b) cumulative time each truck in the truck
fleet wasted in queues.
a)
a)
8
9
IQ II 12 1l H
IS
N.~p lintion :o;'am M r
1!!!!11. \ llLI' - • S
"
b)
80
- - - - - - - - - - - - - - - - - - - - - - - - - - - - -
" 70
~:~~~ -~-~- ~ -~- ~ -~-~- ~ -~~~~~~~~~~~~
iJ55
~50
"" ; 40
::Js
i-' 30
Ezs
.... 20
IS
10
1900
1800
1700
1600
1400
!300
1200
1100
b)
I lour oropcution
-
Plllr llud Grado - .\!ILl'
-
r2 U r l l u d Gndr - .\ULI'
- • lli>i>
l'l ll r llndGrodr-8rll