

350
for any set of data. The surface is understood here as a grid of triangles based on a certain
number of points having flat coordinates and a numerical parameter. The surface can be
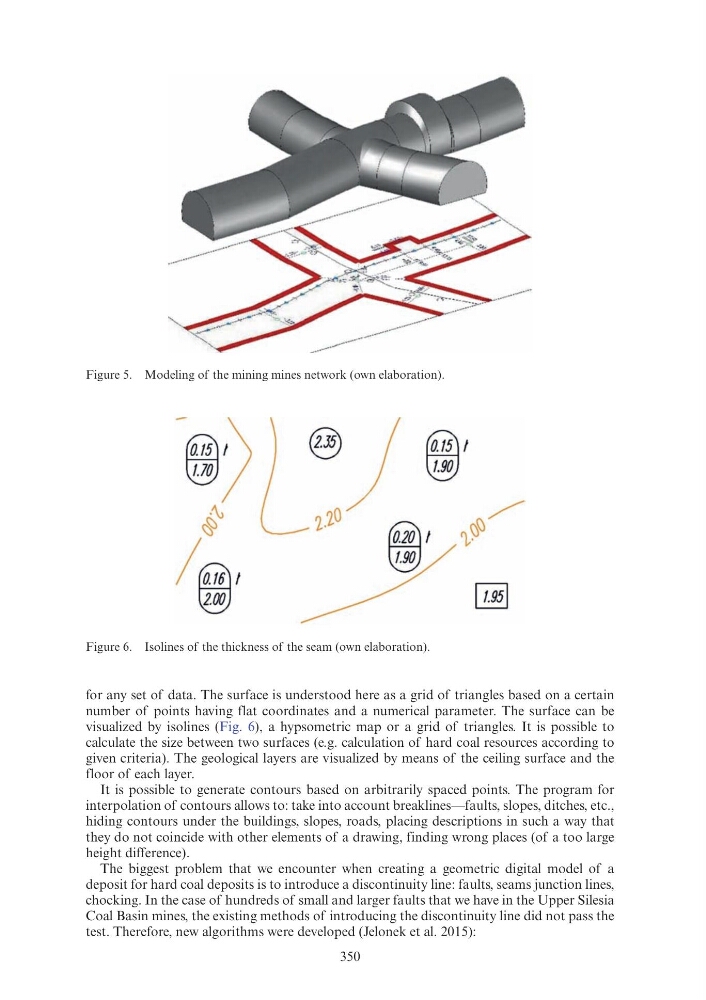
visualized by isolines (Fig. 6), a hypsometric map or a grid of triangles. It is possible to
calculate the size between two surfaces (e.g. calculation of hard coal resources according to
given criteria). The geological layers are visualized by means of the ceiling surface and the
floor of each layer.
It is possible to generate contours based on arbitrarily spaced points. The program for
interpolation of contours allows to: take into account breaklines—faults, slopes, ditches, etc.,
hiding contours under the buildings, slopes, roads, placing descriptions in such a way that
they do not coincide with other elements of a drawing, finding wrong places (of a too large
height difference).
The biggest problem that we encounter when creating a geometric digital model of a
deposit for hard coal deposits is to introduce a discontinuity line: faults, seams junction lines,
chocking. In the case of hundreds of small and larger faults that we have in the Upper Silesia
Coal Basin mines, the existing methods of introducing the discontinuity line did not pass the
test. Therefore, new algorithms were developed (Jelonek et al. 2015):
Figure 5. Modeling of the mining mines network (own elaboration).
Figure 6. Isolines of the thickness of the seam (own elaboration).
-~) ®
~I
1.10
' 0
·"v
2.20
/
~
~~\)
/~,
~I '0
2.00
lt.951
for any set of data. The surface is understood here as a grid of triangles based on a certain
number of points having flat coordinates and a numerical parameter. The surface can be
visualized by isolines (Fig. 6), a hypsometric map or a grid of triangles. It is possible to
calculate the size between two surfaces (e.g. calculation of hard coal resources according to
given criteria). The geological layers are visualized by means of the ceiling surface and the
floor of each layer.
It is possible to generate contours based on arbitrarily spaced points. The program for
interpolation of contours allows to: take into account breaklines—faults, slopes, ditches, etc.,
hiding contours under the buildings, slopes, roads, placing descriptions in such a way that
they do not coincide with other elements of a drawing, finding wrong places (of a too large
height difference).
The biggest problem that we encounter when creating a geometric digital model of a
deposit for hard coal deposits is to introduce a discontinuity line: faults, seams junction lines,
chocking. In the case of hundreds of small and larger faults that we have in the Upper Silesia
Coal Basin mines, the existing methods of introducing the discontinuity line did not pass the
test. Therefore, new algorithms were developed (Jelonek et al. 2015):
Figure 5. Modeling of the mining mines network (own elaboration).
Figure 6. Isolines of the thickness of the seam (own elaboration).
-~) ®
~I
1.10
' 0
·"v
2.20
/
~
~~\)
/~,
~I '0
2.00
lt.951