

349
which allows to choose the optimal velocity and the shape of conducting works. An example
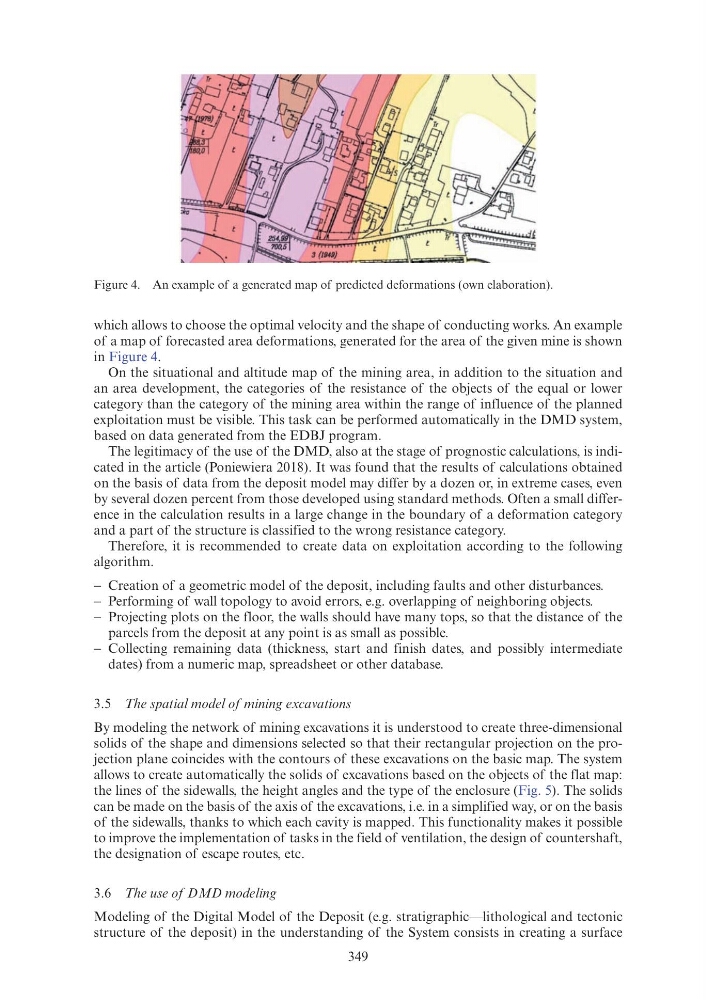
of a map of forecasted area deformations, generated for the area of the given mine is shown
in Figure 4.
On the situational and altitude map of the mining area, in addition to the situation and
an area development, the categories of the resistance of the objects of the equal or lower
category than the category of the mining area within the range of influence of the planned
exploitation must be visible. This task can be performed automatically in the DMD system,
based on data generated from the EDBJ program.
The legitimacy of the use of the DMD, also at the stage of prognostic calculations, is indicated in the article (Poniewiera 2018). It was found that the results of calculations obtained
on the basis of data from the deposit model may differ by a dozen or, in extreme cases, even
by several dozen percent from those developed using standard methods. Often a small difference in the calculation results in a large change in the boundary of a deformation category
and a part of the structure is classified to the wrong resistance category.
Therefore, it is recommended to create data on exploitation according to the following
algorithm.
− Creation of a geometric model of the deposit, including faults and other disturbances.
− Performing of wall topology to avoid errors, e.g. overlapping of neighboring objects.
− Projecting plots on the floor, the walls should have many tops, so that the distance of the
parcels from the deposit at any point is as small as possible.
− Collecting remaining data (thickness, start and finish dates, and possibly intermediate
dates) from a numeric map, spreadsheet or other database.
3.5 The spatial model of mining excavations
By modeling the network of mining excavations it is understood to create three-dimensional
solids of the shape and dimensions selected so that their rectangular projection on the projection plane coincides with the contours of these excavations on the basic map. The system
allows to create automatically the solids of excavations based on the objects of the flat map:
the lines of the sidewalls, the height angles and the type of the enclosure (Fig. 5). The solids
can be made on the basis of the axis of the excavations, i.e. in a simplified way, or on the basis
of the sidewalls, thanks to which each cavity is mapped. This functionality makes it possible
to improve the implementation of tasks in the field of ventilation, the design of countershaft,
the designation of escape routes, etc.
3.6 The use of DMD modeling
Modeling of the Digital Model of the Deposit (e.g. stratigraphic—lithological and tectonic
structure of the deposit) in the understanding of the System consists in creating a surface
Figure 4. An example of a generated map of predicted deformations (own elaboration).
which allows to choose the optimal velocity and the shape of conducting works. An example
of a map of forecasted area deformations, generated for the area of the given mine is shown
in Figure 4.
On the situational and altitude map of the mining area, in addition to the situation and
an area development, the categories of the resistance of the objects of the equal or lower
category than the category of the mining area within the range of influence of the planned
exploitation must be visible. This task can be performed automatically in the DMD system,
based on data generated from the EDBJ program.
The legitimacy of the use of the DMD, also at the stage of prognostic calculations, is indicated in the article (Poniewiera 2018). It was found that the results of calculations obtained
on the basis of data from the deposit model may differ by a dozen or, in extreme cases, even
by several dozen percent from those developed using standard methods. Often a small difference in the calculation results in a large change in the boundary of a deformation category
and a part of the structure is classified to the wrong resistance category.
Therefore, it is recommended to create data on exploitation according to the following
algorithm.
− Creation of a geometric model of the deposit, including faults and other disturbances.
− Performing of wall topology to avoid errors, e.g. overlapping of neighboring objects.
− Projecting plots on the floor, the walls should have many tops, so that the distance of the
parcels from the deposit at any point is as small as possible.
− Collecting remaining data (thickness, start and finish dates, and possibly intermediate
dates) from a numeric map, spreadsheet or other database.
3.5 The spatial model of mining excavations
By modeling the network of mining excavations it is understood to create three-dimensional
solids of the shape and dimensions selected so that their rectangular projection on the projection plane coincides with the contours of these excavations on the basic map. The system
allows to create automatically the solids of excavations based on the objects of the flat map:
the lines of the sidewalls, the height angles and the type of the enclosure (Fig. 5). The solids
can be made on the basis of the axis of the excavations, i.e. in a simplified way, or on the basis
of the sidewalls, thanks to which each cavity is mapped. This functionality makes it possible
to improve the implementation of tasks in the field of ventilation, the design of countershaft,
the designation of escape routes, etc.
3.6 The use of DMD modeling
Modeling of the Digital Model of the Deposit (e.g. stratigraphic—lithological and tectonic
structure of the deposit) in the understanding of the System consists in creating a surface
Figure 4. An example of a generated map of predicted deformations (own elaboration).