

348
Other important, from the point of view of creating the surveying—geological documentation of the possibilities of the system are to create: the thickness and straightness chart of
the wall, a diagram of chemical analysis of water, a rose of cracks, cross-sections through a
rock mass and many others. It is essential that it is possible to obtain text and graphics documentation in a traditional form at any time.
3.4 Effects of mining works in the rock mass and on the surface
Mining exploitation causes effects on the surface, hence the integration of DMD data with
data contained on the maps of the mining area surface is essential. This data has been
included in the DMD system. Mining company operations plans must be agreed with the
relevant local government units.
Modeling the effects of mining works in the rock mass and on the surface of the area is
understood as the possibility of creating the surface of the chosen parameter, (e.g. predicted
or observed depressions of the area), adding two surfaces to each other (e.g. the surface of
the area and the forecasted declines) and receiving the forecasted sculpture of the surface
of the area as a result. Based on the functionality of the DMD system, you can automate
the procedure of creating, among others data sets describing mining exploitation, both the
parcels and the calculation points, checking and improving these data, various visualization of source data and calculations results, data sets. Such solution enables an immediate
obtaining of data on the impact of the planned exploitation on the rock mass and surface,
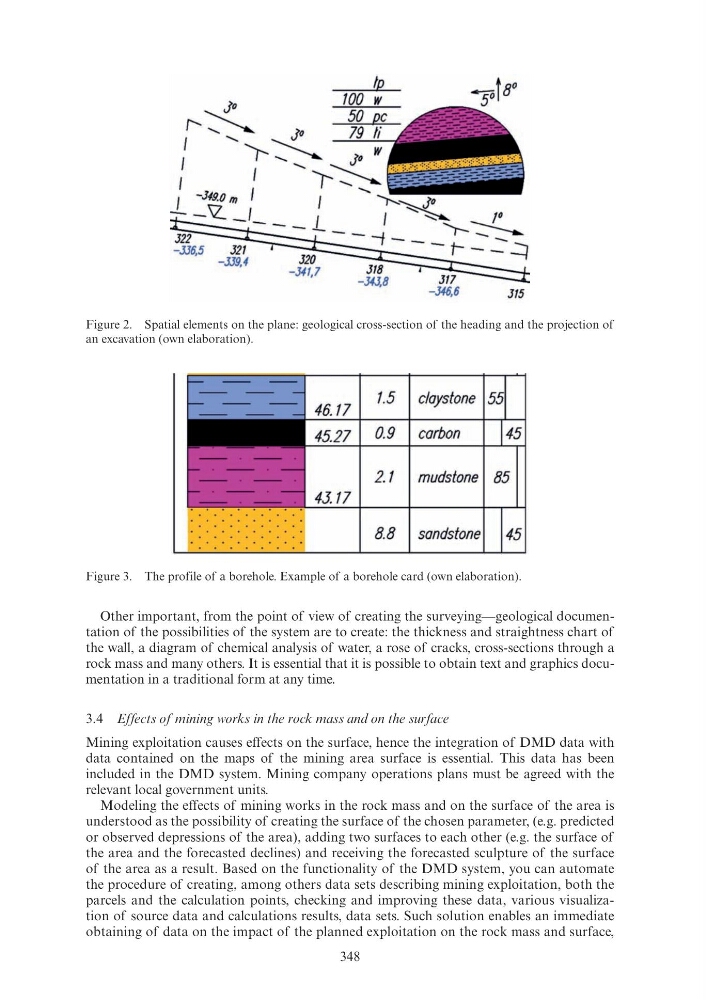
Figure 2. Spatial elements on the plane: geological cross-section of the heading and the projection of
an excavation (own elaboration).
Figure 3. The profile of a borehole. Example of a borehole card (own elaboration).
46.17
1.5 claystone
45.27 0.9 carbon
45
2.1
mudstone 85
4117
8.8 sandstone 45
Other important, from the point of view of creating the surveying—geological documentation of the possibilities of the system are to create: the thickness and straightness chart of
the wall, a diagram of chemical analysis of water, a rose of cracks, cross-sections through a
rock mass and many others. It is essential that it is possible to obtain text and graphics documentation in a traditional form at any time.
3.4 Effects of mining works in the rock mass and on the surface
Mining exploitation causes effects on the surface, hence the integration of DMD data with
data contained on the maps of the mining area surface is essential. This data has been
included in the DMD system. Mining company operations plans must be agreed with the
relevant local government units.
Modeling the effects of mining works in the rock mass and on the surface of the area is
understood as the possibility of creating the surface of the chosen parameter, (e.g. predicted
or observed depressions of the area), adding two surfaces to each other (e.g. the surface of
the area and the forecasted declines) and receiving the forecasted sculpture of the surface
of the area as a result. Based on the functionality of the DMD system, you can automate
the procedure of creating, among others data sets describing mining exploitation, both the
parcels and the calculation points, checking and improving these data, various visualization of source data and calculations results, data sets. Such solution enables an immediate
obtaining of data on the impact of the planned exploitation on the rock mass and surface,
Figure 2. Spatial elements on the plane: geological cross-section of the heading and the projection of
an excavation (own elaboration).
Figure 3. The profile of a borehole. Example of a borehole card (own elaboration).
46.17
1.5 claystone
45.27 0.9 carbon
45
2.1
mudstone 85
4117
8.8 sandstone 45