

347
3.2 Updating the database—entering changes into the model
The data introduced by the vectorization method of the raster images were continuously
updated with data from indirect field measurements. The system provides the possibility of
entering data into the database saved in the files in the DXF and SHAPEFILE formats.
The issue of data import is discussed by the authors in the article (Sokoła-Szewioła &
Poniewiera 2017). Almost all geodetic calculations can be performed in the graphic edition
of the database objects. There are a number of applications, for example, for inserting mining
excavations into the AutoCAD program. This allows for automatic creation and joining of
excavations. From the operator’s side, it is only necessary to enter the coordinates of the point
and measurements to the sidewalls. The entered data is subject to ongoing control, using a
number of functions available in the software.
3.3 Preparation of surveying—geological documentation
The task of the system is to support the work of the surveying—geological departments.
GEOLISP software allows to automate the process of creating the overview maps and special
mining, geological excavations and the surface maps, in terms of content and the standard
compliant with the law. Maps can be generated on the selected scale. The principle was
adopted that the objects are entered into the system in the graphic edition, in the scale 1: 1000.
Next, the desired scale is being generated keeping the size and shape of conventional signs and
descriptions in accordance with the standards. The system allows to generalize the content
of the map, the readability of the map, the selection of the optimal location of descriptions.
An important element of the system is the possibility of transformation of spatial data
conducted in the local system to the national system, in accordance with the requirements
contained in the Regulation (Regulation 2015). This issue was also the subject of research
work carried out at the Silesian University of Technology in 2017–2018. As a result, an
algorithm for one-stage transformation was developed, allowing for higher transformation
accuracy (Sokoła-Szewioła 2017, Sokoła-Szewioła et al. 2018).
One of the important possibilities of the system is the possibility of presenting threedimensional objects on the plane, such as: the cross-section of an excavation, geological
profile, isolines, etc. Flat objects such as isolines or diagrams, as a rule, more clearly and
precisely represent the spatial properties of the rock mass than the spatial model.
The chart of the floor of excavation, the dimensioning of the longwall, the cross-section
through the excavation is much more convenient to obtain based on the attributes of
the map elements than by defining the appropriate surfaces that cross the model in a given place.
The system contains commands related to the creation and editing of longitudinal and
transverse cross sections, as well as many typical chart diagrams. Based on the data, a profile
of a borehole can also be created (Fig. 3).
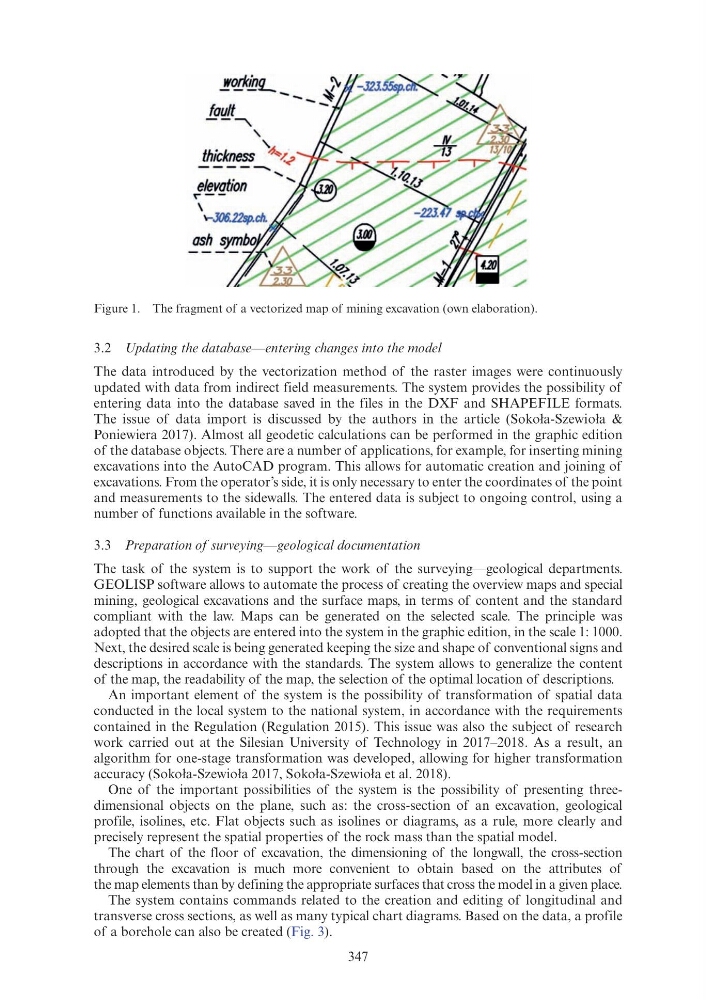
Figure 1. The fragment of a vectorized map of mining excavation (own elaboration).
3.2 Updating the database—entering changes into the model
The data introduced by the vectorization method of the raster images were continuously
updated with data from indirect field measurements. The system provides the possibility of
entering data into the database saved in the files in the DXF and SHAPEFILE formats.
The issue of data import is discussed by the authors in the article (Sokoła-Szewioła &
Poniewiera 2017). Almost all geodetic calculations can be performed in the graphic edition
of the database objects. There are a number of applications, for example, for inserting mining
excavations into the AutoCAD program. This allows for automatic creation and joining of
excavations. From the operator’s side, it is only necessary to enter the coordinates of the point
and measurements to the sidewalls. The entered data is subject to ongoing control, using a
number of functions available in the software.
3.3 Preparation of surveying—geological documentation
The task of the system is to support the work of the surveying—geological departments.
GEOLISP software allows to automate the process of creating the overview maps and special
mining, geological excavations and the surface maps, in terms of content and the standard
compliant with the law. Maps can be generated on the selected scale. The principle was
adopted that the objects are entered into the system in the graphic edition, in the scale 1: 1000.
Next, the desired scale is being generated keeping the size and shape of conventional signs and
descriptions in accordance with the standards. The system allows to generalize the content
of the map, the readability of the map, the selection of the optimal location of descriptions.
An important element of the system is the possibility of transformation of spatial data
conducted in the local system to the national system, in accordance with the requirements
contained in the Regulation (Regulation 2015). This issue was also the subject of research
work carried out at the Silesian University of Technology in 2017–2018. As a result, an
algorithm for one-stage transformation was developed, allowing for higher transformation
accuracy (Sokoła-Szewioła 2017, Sokoła-Szewioła et al. 2018).
One of the important possibilities of the system is the possibility of presenting threedimensional objects on the plane, such as: the cross-section of an excavation, geological
profile, isolines, etc. Flat objects such as isolines or diagrams, as a rule, more clearly and
precisely represent the spatial properties of the rock mass than the spatial model.
The chart of the floor of excavation, the dimensioning of the longwall, the cross-section
through the excavation is much more convenient to obtain based on the attributes of
the map elements than by defining the appropriate surfaces that cross the model in a given place.
The system contains commands related to the creation and editing of longitudinal and
transverse cross sections, as well as many typical chart diagrams. Based on the data, a profile
of a borehole can also be created (Fig. 3).
Figure 1. The fragment of a vectorized map of mining excavation (own elaboration).